Last updated: July 24, 2026
Captopril Market Dynamics and Financial Trajectory (2020–2026): Sales Geography, Competitive Pressures, and Genericization Outlook
Captopril is an off-patent, multi-competitor oral ACE inhibitor with mature, value-focused demand driven by hypertension, heart failure, and post–myocardial infarction indications. Market dynamics are dominated by (1) generic volume share, (2) price compression, (3) hospital formularies and guideline continuity, and (4) country-level access constraints tied to procurement and reimbursement. Financial trajectory follows a classic “legacy generic” pattern: revenue growth is limited and tied to population, formulary retention, and tender cycles rather than innovation.
How is the global captopril market behaving: volume vs price pressure?
Captopril’s commercial model
- Therapy class: Angiotensin-converting enzyme (ACE) inhibitors.
- Core uses: Essential hypertension, congestive heart failure, and secondary prevention after myocardial infarction (where indicated).
- Supply structure: Broad generic manufacturing footprint with multiple authorized and unauthorised sources depending on jurisdiction.
- Revenue logic:
- Sales are mainly quantity-driven (generic penetration is already high).
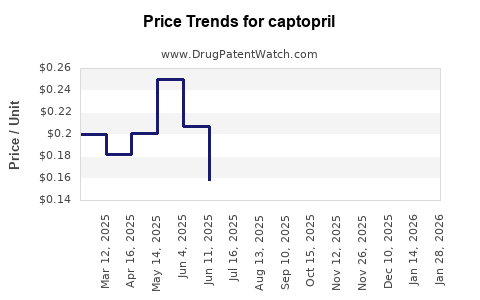
- Unit price is the main determinant of value, and it tends to compress with each tender and new entrant.
What typically drives price
- Public and private tendering in lower- and middle-income markets.
- Reimbursement benchmarks that push prices to the lowest-cost credible bidder.
- Ongoing substitution to other ACE inhibitors (e.g., lisinopril) or ARBs where reimbursement favors them.
What typically drives volume
- Guideline continuity supporting ACE inhibition for HFrEF and hypertension.
- Formularies that keep captopril as a low-cost option for step-down from branded or higher-cost alternatives.
- Margin-preserving regional procurement where manufacturers compete on supply reliability.
Which regions generate the most captopril demand and where are the biggest revenue swings?
Demand concentration pattern
Captopril demand is typically strongest in:
- Established generic markets with stable chronic care volumes and fixed-tender procurement.
- High-diagnosis-volume geographies where hypertension detection and treatment are expanding faster than branded alternatives.
Revenue swing drivers by region
- Latin America: frequent tender cycles and currency effects often translate into short-cycle revenue volatility.
- Middle East and North Africa: formulary stability can support volume, but procurement rules can still drive price resets.
- South and Southeast Asia: volume tends to be resilient, but pricing is sensitive to batch-level contract awards.
- Europe and North America: markets skew to low-growth, lower-price, steady substitution dynamics.
Commercial implication
Because captopril is off-patent, financial trajectory is rarely about share gain versus “survival pricing” and “contract capture.” The winners are typically the manufacturers with (1) procurement scale, (2) reliable manufacturing capacity, and (3) stable regulatory status across target countries.
How many generic companies sell captopril, and how does that affect market share economics?
Competitive landscape: typical structure
- Dozens to hundreds of generic suppliers across global and regional labels depending on jurisdiction.
- Competition concentrates around:
- Lowest net price
- Tender eligibility and dossier status (regulatory defensibility)
- Packaging and strength availability for hospital use
Market share economics in legacy generics
- Brand-like differentiation is limited because the product is the same drug substance and formulation type (mostly tablets; sometimes oral solution depending on country).
- Margin is compressed early and further with additional entrants and price resets.
- Profitability tends to concentrate in:
- Companies with lower COGS and high utilization
- Those with stable long-term purchase agreements or preferred formulary positions
What is the financial trajectory of captopril as a legacy ACE inhibitor: growth, stability, or decline?
Base case pattern
Captopril’s financial trajectory generally follows:
- Stable-to-slow decline in real revenue in mature markets due to continued substitution and price compression.
- Near-flat volume with price-driven revenue volatility in procurement-heavy regions.
- Local growth when access programs, hospital formularies, or hypertension-treatment scale-up increase patient counts.
What can reverse decline
- Expanded hypertension or heart failure treatment programs.
- Shifts in guideline adoption that favor ACE inhibitors over alternatives in specific payor systems.
- Supply stability that improves contract retention for certain manufacturers.
What usually accelerates decline
- Payor incentives pushing ARBs or newer ACE inhibitors where pricing allows.
- Procurement frameworks that favor large suppliers with the lowest landed cost.
- Regulatory disruptions at manufacturing sites that force temporary supply substitution.
When does captopril lose exclusivity, and what does that imply for generic entry risk?
Exclusivity status
Captopril is a long-established medicine and is not under meaningful active exclusivity in most markets today. That translates into:
- Low barrier to generic entry
- High probability of immediate competition post-local origin brand wind-down
- Limited ability to monetize differentiation without strong formulation/device or method-of-use IP
Generic entry risk
- In jurisdictions where captopril is already widely genericized, incremental entry risk is less about “legal entry blocks” and more about:
- regulatory dossier maintenance
- manufacturing compliance continuity
- tender scoring models (bioequivalence, GMP inspections, supply chain metrics)
What patents (if any) still matter economically for captopril: method-of-use, formulation, or pediatric exclusivity?
For captopril, the core active ingredient and immediate formulation IP are typically long expired. Remaining economic relevance, when present, usually comes from:
- Secondary patents (process, polymorphs, stable formulations)
- Method-of-use (specific patient subgroups, dosing regimens) that may not be enforceable broadly because captopril is already established
- Country-specific pediatric extensions or data exclusivity, where applicable, but the compound is widely genericized
Market impact: in most mature markets, any remaining secondary IP seldom changes the competitive structure meaningfully because multiple generics can coexist and tender pricing drives economics.
What does captopril’s FDA and regulatory status imply for commercial supply and launch strategy?
Regulatory reality for a legacy drug
In the US, captopril is typically supplied as an approved generic or referenced product with broad Abbreviated New Drug Application (ANDA) coverage where applicable.
Commercial implications
- Launch friction is usually regulatory maintenance and bioequivalence rather than patent litigation.
- Ongoing supply is constrained by:
- manufacturing capacity and GMP compliance
- strength availability and packaging formats that match formularies
Does captopril face biosimilar-style risk or only generic substitution risk?
Captopril is a small-molecule drug. It does not face biosimilar dynamics. The competitive risk is:
- Generic substitution and
- Therapeutic substitution (patients switching among ACE inhibitors and ARBs based on tolerability and payor preferences).
How does captopril compare commercially with other ACE inhibitors like lisinopril and enalapril?
Competitive comparison framework
Key commercial differences between ACE inhibitors are:
- Formulary preference (institutional protocol)
- Dosage convenience (strengths, dosing frequency)
- Switching inertia (tolerability history, physician familiarity)
- Net price (tender outcomes)
Typical market behavior
- If a market has low-cost dominance for lisinopril or enalapril, captopril volume can shift downward.
- If payors prioritize “lowest acquisition cost” within ACE inhibitors, captopril can remain resilient.
- Where clinicians prefer captopril’s titration profile or where local supply is advantaged, captopril sustains usage even if unit prices are low.
Net effect on financial trajectory: captopril’s trajectory is tied to relative net price versus close ACE alternatives, not to innovation cycles.
What drives tender performance and profitability for captopril manufacturers?
Tender performance levers
- Lowest net landed price after logistics and discounts
- Availability and fill-rate history
- Regulatory status across the tender’s participating countries
- Stability of packaging and strength portfolio
Margin structure
- Generics at scale often run with thin margins.
- Profit is made by:
- manufacturing scale economies
- minimizing batch failures or recall events
- optimizing strength-level production
Which business scenarios best explain captopril’s financial trajectory over the next 2–4 years?
Scenario A: Stable volume, incremental price erosion
- Most plausible in mature markets.
- Financial outcomes depend on staying on preferred lists and maintaining supply continuity.
Scenario B: Regional procurement shocks
- Plausible where tenders reset periodically and where currency and logistics materially affect landed cost.
- Results: short-term swings in revenue without long-term share gains.
Scenario C: Therapeutic substitution away from captopril
- Plausible where ARB access improves or where other ACE inhibitors become cheaper in procurement baskets.
- Results: volume decline, offset only partially by acquisition of tender share.
Key Takeaways
- Captopril’s market dynamics are dominated by generic volume economics and tender-driven price compression.
- Financial trajectory is typically low-growth with revenue changes driven by net price resets and contract capture, not innovation or major IP-driven exclusivity.
- Region-level differences matter most through procurement mechanics, reimbursement benchmarks, and supply reliability.
- Competitive pressure comes mainly from other ACE inhibitors and ARBs plus the breadth of generic suppliers, not from biosimilar-style pathways.
- Over the next 2–4 years, captopril’s most likely path is stable or modestly declining value with volume resilience where hypertension and heart failure treatment programs expand.
FAQs
1) Why does captopril revenue often track tenders more than prescriptions?
Because in many jurisdictions the purchase price is set through tender frameworks, and unit revenue follows net acquisition cost more directly than prescription-level persistence.
2) Does captopril have significant formulation diversity that changes market outcomes?
Typically not at scale. Most markets use conventional tablets and a limited set of strengths, so competitive advantage is usually supply and price rather than novel delivery systems.
3) What supply-chain issues most threaten captopril continuity in hospitals?
GMP inspection findings, batch failures, recalls, and constraints at key manufacturing sites that force temporary substitutions at the point of use.
4) How do payers decide between captopril and other ACE inhibitors?
Primarily via net price, formulary status, and evidence of tolerability in local prescribing patterns, with therapeutic equivalence shaping substitution.
5) Is litigation a meaningful driver of captopril market share today?
For captopril, the dominant driver is usually generic coexistence and procurement competition rather than active patent blocking, given the compound’s long market history.
References (APA)
- FDA. (n.d.). Drug Approval Reports and databases (Drugs@FDA). U.S. Food and Drug Administration.
- FDA. (n.d.). Orange Book: Approved Drug Products with Therapeutic Equivalence Evaluations. U.S. Food and Drug Administration.
- WHO. (n.d.). Guidelines and treatment recommendations for hypertension and heart failure (ACE inhibitors). World Health Organization.
- EMA. (n.d.). European public assessment reports and product information (ACE inhibitors). European Medicines Agency.