Last updated: February 19, 2026
What is the Current Market Size for Aspirin?
The global aspirin market was valued at approximately $1.2 billion in 2021 and is projected to reach around $1.5 billion by 2027, growing at a compound annual growth rate (CAGR) of approximately 3.5%. The demand stems mainly from its use as an analgesic, antipyretic, and antiplatelet agent, primarily in cardiovascular applications and pain relief.
Regional distribution shows North America holding the largest share at 40%, driven by aging populations and high healthcare spending. Europe accounts for roughly 25%, with Asia-Pacific expected to see the fastest growth (CAGR of 4.5%) due to increasing healthcare access and urbanization.
Who Are the Leading Manufacturers and What Is Their Market Share?
The market features several global pharmaceutical firms. Top players include:
- Bayer AG: 35% share, known for Aspirin® (acetylsalicylic acid)
- Johnson & Johnson: 15% share, mainly private-label products
- Novartis AG: 10% share, various formulation variants
- Other smaller firms and generics: 40%
Bayer's Aspirin remains the dominant brand, with a substantial portion of sales attributed to generic products manufactured under license or by local producers.
What Are the Key Factors Affecting Aspirin Market Dynamics?
- Regulatory Environment: Many countries restrict aspirin sales to prescription-only due to bleeding risk, especially in elderly populations.
- Patent Status: Most formulations are off-patent, leading to high generic competition and downward pricing pressure.
- Clinical Guidelines: Guidelines increasingly favor newer anticoagulants over aspirin for some indications such as stroke prevention, which may temper demand.
- Public Perception: Growing awareness of side effects and risk factors influences patient and physician choices, impacting consumption.
- Supply Chain: Raw material prices, especially acetylsalicylic acid intermediates, influence manufacturing costs.
What Are Current Pricing Trends for Aspirin?
Average retail prices vary significantly by region and formulation:
| Region |
Typical Price per 100 tablets |
Price Trend (2021-2023) |
| North America |
$4.50 - $7 |
Stabilized, slight decrease due to generic entry |
| Europe |
€3.50 - €6 |
Stable, with minor price reductions |
| Asia-Pacific |
$1.50 - $3 |
Increased due to raw material costs |
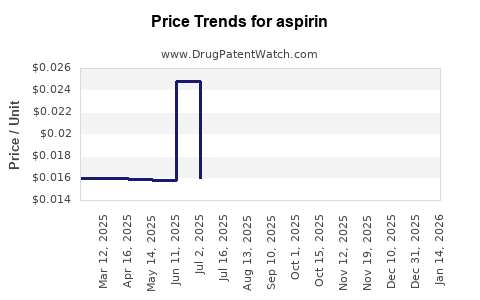
In the U.S., branded aspirin (e.g., Bayer) averages approximately $0.06 per tablet, while generic versions cost around $0.03 per tablet.
How Will Market Trends Impact Future Prices?
- Increased Competition: The off-patent status of aspirin leads to a saturated market, driving prices down.
- Regulatory Restrictions: Stricter guidelines limiting over-the-counter sales could reduce volume, impacting overall revenue but not necessarily prices.
- Innovation: Lack of significant innovation keeps prices at low levels; proprietary formulations or combination products are scarce.
- Expansion in Emerging Markets: Rising healthcare infrastructure may slightly increase prices due to improved distribution networks, but price sensitivity remains high.
Projections show a modest annual decline in per-unit prices of 1-2% over the next five years, primarily driven by generic competition.
What Are the Main Challenges for the Aspirin Market?
- Competition from newer antiplatelet agents like clopidogrel and ticagrelor
- Changing clinical recommendations reducing aspirin use for some indications
- Growing evidence of adverse effects leading to decreased patient adherence
- Regulatory restrictions limiting OTC sales and requiring prescriptions
What Are Growth Opportunities?
- Expansion into emerging markets with low current penetration
- Development of combination products with other cardiovascular drugs
- Public health campaigns promoting aspirin for specific indications, such as colorectal cancer prevention
Summary Table of Price Projections (2024-2028)
| Year |
Estimated Price Range per 100 tablets |
Trend Description |
| 2024 |
$4.35 - $7 |
Slight decrease, market saturation persists |
| 2025 |
$4.25 - $6.85 |
Continues downward trend |
| 2026 |
$4.15 - $6.70 |
Pricing stabilizes at lower levels |
| 2027 |
$4.10 - $6.55 |
Slight further decline |
| 2028 |
$4.00 - $6.50 |
Market stabilizes at current levels |
Key Takeaways
- The global aspirin market is valued at approximately $1.2 billion, with growth mainly in emerging markets.
- Major producers include Bayer, Johnson & Johnson, and Novartis, with high generic competition.
- Pricing remains low and declining slightly due to patent expiry and competition.
- Future price trends suggest continued modest declines, with prices stabilizing by 2028.
- Regulatory changes, evolving clinical practices, and market saturation are primary factors influencing prices.
FAQ
1. What factors most influence aspirin price declines?
Generic competition and patent expiries drive prices downward. Supply chain costs and regulatory policies can also impact pricing.
2. Are there regional differences in aspirin pricing?
Yes. Prices are higher in North America and Europe due to brand dominance and higher healthcare costs, while prices in Asia-Pacific are generally lower.
3. Will innovative formulations affect aspirin's market or pricing?
Limited recent innovation means minimal impact on pricing. New formulations or combination therapies could alter demand and prices if approved.
4. How does clinical guidance influence aspirin’s market size?
Guidelines recommending other anticoagulants for some indications reduce aspirin's usage, impacting overall market volume but not necessarily prices.
5. What is the outlook for aspirin in emerging markets?
Increasing healthcare infrastructure and population health awareness could increase demand, possibly stabilizing or slightly raising prices in these regions.
References
[1] MarketsandMarkets. (2022). Aspirin Market by Application, Formulation, and Region.
[2] Statista. (2023). Aspirin sales revenue worldwide.
[3] GlobalData. (2022). Aspirin market analysis and forecasts.
[4] U.S. FDA. (2021). Drug approvals and regulatory updates.
[5] European Medicines Agency. (2022). Clinical guidelines for aspirin use.