Last updated: July 11, 2026
Warfarin is a mature, generic-dominated anticoagulant with persistent global demand tied to atrial fibrillation (AF), venous thromboembolism (VTE), and mechanical heart valves. Pricing is structurally pressured by low manufacturing complexity, multi-supplier availability, and high prescriber familiarity, with limited room for sustained price growth outside of narrow segments (brand or specialty strengths, supply-constrained SKUs, and select international procurement regimes).
What is the warfarin market size and growth outlook by region?
Warfarin’s market is large but slow-growing because use is driven by prevalence of AF and VTE, while switching to direct oral anticoagulants (DOACs) has reduced relative share in many markets. Warfarin continues to hold share where DOAC access is constrained by cost, renal criteria, drug interactions, or clinical preference.
U.S. demand drivers
- Clinical drivers: AF stroke prevention, VTE treatment and secondary prevention, and mechanical heart valve thromboprophylaxis.
- Structural drivers: entrenched monitoring workflows (INR clinics), long safety/efficacy history, and broad generic availability.
- Competitive pressure: DOAC penetration, but warfarin remains favored in settings where DOAC coverage is limited or INR monitoring infrastructure exists.
EU and UK demand drivers
- Continued use where national health systems favor cost containment.
- Uptake of DOACs varies by country procurement and guideline adherence, but warfarin remains widely prescribed due to low acquisition cost.
International demand drivers
- Lower-income and constrained healthcare systems often prioritize warfarin due to affordability and inclusion in essential medicines frameworks.
How much do warfarin prices vary across dosage strengths and formulations?
Warfarin is sold as inexpensive oral tablets (and in some markets, brand products and different salt forms depending on jurisdiction). Pricing varies mainly by:
- Tablet strength and pack size (e.g., 1 mg, 2 mg, 2.5 mg, 3 mg, 4 mg, 5 mg).
- Supply availability and distribution channel (wholesale vs hospital procurement).
- Brand vs generic mix.
- Regulatory and reimbursement regimes.
U.S. typical pricing behavior
In the U.S., most warfarin tablets are priced at low single-digit to tens of dollars per bottle depending on strength and package size, with wholesale acquisition costs (WAC) frequently close to net price floors due to generic competition and rebate structures.
Formulation considerations
Warfarin’s core molecule is stable and manufacturable at scale. Pricing dispersion is usually not due to novel formulation IP but due to procurement contracts and intermittent supply constraints.
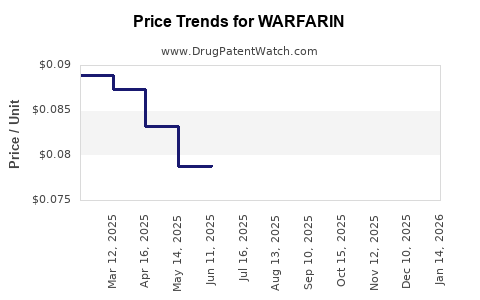
What do historical warfarin price trends look like, and what explains them?
Warfarin has shown:
- Persistent price pressure from generic entry and increased manufacturer count.
- Occasional step-ups during supply disruptions, quality remediation actions, or temporary production downtime.
- Gradual increases tied to inflation in raw materials and logistics, but these are typically absorbed by net pricing rather than moving list price significantly.
Key pricing determinants
- Number of active generic manufacturers in a given strength and label configuration.
- Contracting power of large buyers (GPOs, IDNs, large retail chains).
- Limited brand differentiation for most purchasers.
- Wholesale distribution incentives.
Which companies sell warfarin in the U.S., and how does competition impact pricing?
Warfarin is broadly marketed by multiple generic manufacturers. Competition reduces pricing, but not evenly across strengths. Strengths with fewer qualified suppliers tend to experience higher pricing or more volatility.
Competition pattern
- High coverage for commonly dispensed strengths (2 mg, 2.5 mg, 5 mg).
- Strengths with lower utilization can be more prone to supplier exit and supply constraints, raising acquisition cost temporarily.
What is the Orange Book status of warfarin in the U.S.?
Warfarin is the canonical example of a small-molecule where current prescribing is largely supported by generic products. In the U.S., the practical implication for exclusivity is that:
- The original brand era has ended.
- Today’s warfarin market is driven by ANDA products and generic manufacturing authorizations.
- Patent estates that matter are often limited in the sense that they rarely constrain core tablet warfarin availability at the molecule level; instead, constraints are more likely to arise from:
- packaging/labeling variants,
- manufacturing process-specific patents (where asserted), or
- supply bottlenecks.
What patents protect warfarin tablets, and do they affect market pricing?
In the present market, the warfarin value chain is not shaped by active molecule-level exclusivity. Price is shaped by generic competition and manufacturing capacity. Patent impact is usually indirect:
- Litigation or consent decrees can temporarily limit certain filings.
- Manufacturing process constraints may affect who can produce a specific strength under current controls.
Patent reality for a mature generic
For warfarin, the binding economic question is not “how many years left on exclusivity,” but “how many qualified suppliers remain for each strength and package configuration.” When supplier count is high, price compresses.
When does warfarin lose exclusivity, and what would it change commercially?
Warfarin is already beyond meaningful molecule-level exclusivity in most major markets. Commercial impact today would come from:
- supply constraints that reduce qualified inventory,
- regulatory actions affecting specific manufacturers, or
- market consolidation that reduces supplier count for a strength.
A generic drug with no active exclusivity cannot create large step changes in price unless supply changes.
How many Paragraph IV challenges exist for warfarin ANDAs, and what is the economic significance?
For warfarin tablets, Paragraph IV litigation has historically occurred around brand-origin products, but in the current environment:
- new meaningful competitive changes typically come from supply-side entry, not from legal entry barriers at the molecule level.
- the economic impact of any single case is often short-lived unless it results in settlement terms extending exclusivity for specific product configurations.
What biosimilar risk exists for warfarin?
None. Warfarin is a small-molecule chemical drug, not a biologic. Biosimilar pathways do not apply.
What regulatory milestones matter for warfarin pricing and availability (FDA, GMP, shortages)?
Warfarin’s availability is impacted by:
- FDA GMP compliance status for specific manufacturing sites.
- Drug shortages listings and enforcement actions.
- Labeling or packaging changes that can shift procurement behavior.
Shortage-driven price spikes
Price volatility can occur when:
- a major manufacturer is offline for remediation,
- raw material sourcing is constrained,
- or distribution channels pull forward demand.
These events can temporarily lift WAC and net pricing until capacity returns.
How will warfarin pricing develop over the next 1 to 5 years? (Projections)
Warfarin pricing projections should be interpreted as scenario-based around supplier count and shortage events, since legal exclusivity is not the core driver. Baseline expectations:
- Mild nominal increases aligned with inflation, with real pricing flat to slightly down due to ongoing generic competition.
- Volatility concentrated around strength-specific supply.
Base case (most likely)
- Nominal prices drift upward at a low single-digit rate annually due to inflation in labor, energy, and logistics.
- Net prices remain near competition-driven floors, so real increases are limited.
- Market share remains stable for warfarin, with DOAC substitution continuing to reduce incremental growth.
Upside case (supply constrained)
- Shortages for specific strengths lift pricing and improve manufacturer profitability.
- Higher acquisition cost persists until new entrants regain supply coverage or existing plants restore throughput.
- This case is intermittent rather than structural.
Downside case (supply expansion and contract pressure)
- New or restarted suppliers increase inventory, pushing pricing down.
- Contracting intensifies and GPO-led procurement locks in lower net prices.
- Any price increases become temporary.
What is the pricing outlook for hospital vs retail channels?
Hospital channel
- Pricing tracks GPO contracts and formulary behavior.
- Tends to be less volatile unless a shortage forces switching or procurement of alternative strengths.
Retail channel
- More sensitive to consumer distribution patterns, but warfarin is typically low-cost, so price sensitivity remains high.
- When supplier availability changes, retail acquisition costs can move, but competitive pressure drives recovery quickly once supply returns.
How do DOAC competition and clinical guidelines affect warfarin net revenue?
DOAC substitution is the main demand headwind for warfarin:
- In many AF patients, DOACs displace warfarin due to lack of INR monitoring and convenience.
- Warfarin retains a durable role for populations where DOACs are less favored due to:
- mechanical heart valves,
- certain contraindications,
- complex drug-drug interaction profiles,
- access constraints and affordability.
Net effect: warfarin remains “staple therapy” but with low volume growth, making pricing, availability, and supplier count the key levers for revenue.
What generic entry risks exist for warfarin tablets?
For incumbent generics, the main risks are:
- Loss of supply capacity (plant downtime, quality issues).
- Contract re-tendering that changes preferred supplier lists.
- Regulatory actions that temporarily restrict specific manufacturers.
For new entrants, barriers are mostly operational rather than IP:
- ANDA readiness and manufacturing controls.
- Capacity commitments to cover multiple strengths and package sizes without triggering supply gaps.
How does warfarin compare with other oral anticoagulants on pricing and margin potential?
Warfarin generally trades at:
- lower per-unit prices than DOACs,
- lower absolute revenue per treatment course,
- but potentially steadier demand because monitoring-based workflows and specific indications remain.
Margins for warfarin suppliers depend on:
- manufacturing scale efficiency,
- ability to maintain supply uninterrupted,
- and contract terms that can shift quickly during re-bids.
What commercial levers can matter most to a warfarin manufacturer?
- Strength coverage and package assortment that aligns with GPO and payer formularies.
- Manufacturing resilience and redundancy to prevent shortage-driven demand surges that can later normalize.
- Procurement contracting strategy to protect net pricing during competitive bidding cycles.
- Quality systems that prevent FDA actions at manufacturing sites.
Key Takeaways
- Warfarin is a mature, generic-heavy market with pricing driven primarily by supplier count and supply continuity, not by active exclusivity.
- Demand growth is limited by ongoing DOAC substitution, but warfarin retains durable use for mechanical heart valves and settings where DOAC access or suitability is constrained.
- Pricing outlook is low single-digit nominal inflation in the base case, with intermittent strength-specific volatility during supply disruptions.
- Commercial upside is most plausible through supply stabilization and contract wins; downside risk is supplier exits, compliance issues, and aggressive procurement re-tendering.
- Patent and litigation dynamics are unlikely to be the dominant price driver for most tablet configurations today.
FAQs
1) Why do warfarin tablet prices sometimes spike in the U.S.?
Price moves are typically driven by supply disruptions affecting one or more qualified manufacturers for specific strengths, plus procurement timing and temporary shortages that pull inventory forward.
2) Which warfarin strengths are most prone to availability and pricing volatility?
Lower-utilization strengths and specific package configurations can face fewer supplier options, making them more sensitive to plant downtime or quality remediation.
3) Does warfarin pricing depend more on FDA approvals or on GPO contracting?
In practice, warfarin pricing is more sensitive to contracting and supply availability than to incremental regulatory events, given broad ANDA coverage.
4) How does INR monitoring infrastructure influence warfarin demand?
Established INR monitoring workflows support continued warfarin use in health systems that have anticoagulation clinics and standardized management pathways.
5) Is there any biosimilar or interchangeability risk for warfarin?
No biosimilar pathway applies. The main interchangeability risks are generic-to-generic switching effects on dosing stability in individual patients, which typically are managed through monitoring rather than treated as a structural market risk.
References (APA)
- FDA. Drug Shortages Program. U.S. Food and Drug Administration. https://www.accessdata.fda.gov/scripts/drugshortages/default.cfm
- FDA. Orange Book: Approved Drug Products with Therapeutic Equivalence Evaluations. U.S. Food and Drug Administration. https://www.accessdata.fda.gov/scripts/cder/daf/index.cfm
- American Heart Association/American College of Cardiology. Guidelines for management of atrial fibrillation and anticoagulation strategies (latest consolidated guideline documents available on AHA/ACC websites).
- World Health Organization. Essential Medicines List (EML) and anticoagulant listings. https://www.who.int/teams/health-product-and-policy-standards/essential-medicines-access/essential-medicines-list