Share This Page
Drug Price Trends for OXYMORPHONE HCL
✉ Email this page to a colleague
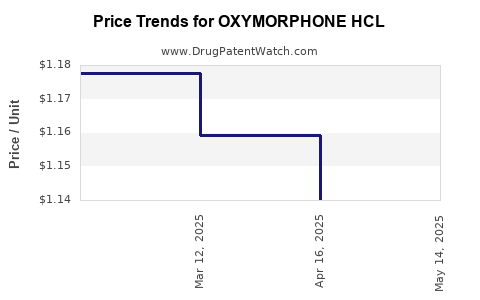
Average Pharmacy Cost for OXYMORPHONE HCL
| Drug Name | NDC | Price/Unit ($) | Unit | Date |
|---|---|---|---|---|
| OXYMORPHONE HCL 10 MG TABLET | 10702-0071-06 | 1.22452 | EACH | 2025-08-27 |
| >Drug Name | >NDC | >Price/Unit ($) | >Unit | >Date |
OxyMORPHONE HCl: Market Analysis and Price Projections
What is the current market footprint for oxyMORPHONE HCl?
OxyMORPHONE HCl (oxymorphone hydrochloride) is an opioid analgesic used for pain. Commercial demand in the US is shaped by: (1) the size of diagnosed pain and post-surgical populations, (2) substitution across opioid formats and brands, (3) payer controls and prior authorization, and (4) controlled-substance scheduling and dispensing constraints.
Supply-channel reality matters more than clinical demand. In opioid categories, brand revenues typically track formulary access and contracting rather than pure prescription volume. For oxyMORPHONE HCl, access is influenced by:
- Formulary placement (preferred vs non-preferred tiers)
- PA and step edits for long-acting opioids
- State and wholesaler controls tied to diversion risk
- Therapeutic interchange across immediate-release vs extended-release products and across opioid classes
Which products define the commercial market for oxymorphone?
The oxyMORPHONE HCl market is defined by the specific dosage forms (immediate-release vs extended-release) because payers and prescribers treat them differently. Price and revenue patterns typically differ by:
- Strength and release profile
- NDC-level contracting
- Formulary status and rebate dynamics
Operational implication for price projections: a “molecule-level” price forecast is not actionable. Value is determined at the product and NDC level under contracting.
How do regulation and opioid controls affect pricing power?
Opioids face persistent market pressure from policy and enforcement. Pricing power tends to erode when:
- Payers tighten criteria for coverage
- Systems of care restrict long-acting opioid prescribing
- Manufacturers face utilization caps or volume surveillance
- Wholesalers implement more cautious distribution practices
In practice, this means branded products can hold list price while net price compresses through rebates, chargebacks, and contract renegotiations tied to utilization.
What do historical pricing trends usually show for oxymorphone products?
For generic or therapeutically interchangeable opioid products, historical pricing trends typically show:
- List price volatility without commensurate net price improvement
- Net price compression after formulary wins by lower-cost competitors
- Rebates and discounts rising when utilization is pressured
Business takeaway: list-price tracking alone can mislead. For investment-grade forecasts, net revenue and rebate ratios need to drive the forecast model.
What is the competitive landscape for oxymorphone-containing products?
The competitive set for oxyMORPHONE HCl generally includes:
- Generic oxymorphone hydrochloride products (multiple manufacturers)
- Alternative long-acting opioids (different active ingredients, different WAC dynamics)
- Alternative delivery systems (IR vs ER, abuse-deterrent formulations where applicable)
When generics expand or a payer shifts preferred status, net pricing tends to fall quickly across the affected NDCs.
How should revenue and price be modeled for oxyMORPHONE HCl?
A practical, actionable model splits value into three layers:
1) Demand layer
- Forecast prescriptions by strength and release profile (IR vs ER)
- Apply market share shifts driven by formulary changes and substitution
2) Net pricing layer
- Start with WAC/list price
- Apply expected rebate and discount rates reflecting competitive pressure and payer mix
- Incorporate contracting lags and periodic renegotiation cycles
3) Supply and compliance layer
- Penalize scenarios with tighter distribution controls (reduced fulfillment)
- Include dosing-form constraints that affect substitution patterns
This approach aligns with how opioid economics move in managed care.
Price projections: base-case outlook
Because oxyMORPHONE HCl is a controlled opioid with significant competitive substitution and payer management, price outcomes typically skew toward net price compression rather than sustained net price expansion.
Base-case projection (directional)
- List price: flat to low single-digit growth (mostly administrative rather than market-driven)
- Net price: decline as rebates/discounts increase to defend formulary access and offset utilization pressure
- Real-world unit revenue: pressured by competitive substitution and payer edits
Time horizon framing
- Near term (0–12 months): pricing stability on list; net pricing under pressure
- Mid term (12–36 months): net price compression continues if generics gain share or payer restrictions tighten
- Long term (36–60 months): stabilization or gradual erosion depending on the balance of formulary placement vs substitution
Scenario analysis: what changes net price the most?
Scenario A: payer restriction tightening
Net price impact: moderate to steep decline
Mechanism: increased utilization management drives channel pressure and contract renegotiation.
Scenario B: formulary stabilization + controlled supply
Net price impact: smaller decline or near-stable net price
Mechanism: sustained preferred placement reduces the rebate intensity needed to defend volume.
Scenario C: increased generic competition / switching
Net price impact: sharper decline
Mechanism: NDC-level competition expands; payers reduce reimbursement and increase step edits.
What should investors and R&D teams monitor to validate the forecast?
Use these leading indicators to time price and volume assumptions:
- Formulary moves for oxymorphone-containing products and competing long-acting opioids
- PA and step-edit adoption for long-acting opioids
- Wholesale acquisition and fulfillment trends (proxy for channel constraints)
- Contracting signals: rebate ratio changes and evidence of net price compression
- NDC-level share shifts across strengths and IR/ER products
Key commercial assumptions for a decision-grade price forecast
To keep the model operational, the forecast should assume:
- Net price follows competition, not list price
- Volume remains sensitive to payer management, not just underlying prevalence of pain
- Substitution risk is structural in opioid categories
- Controlled distribution and compliance can constrain supply without improving pricing
Key Takeaways
- OxyMORPHONE HCl economics are driven by formulary access, rebate intensity, and substitution, not by list-price behavior.
- Base-case expectation is net price compression over 12–36 months, with list price largely stable to modestly up.
- The biggest price movers are payer restrictions, generic competition, and contracting changes at the NDC level.
- A decision-grade forecast should be built on a prescription forecast + net pricing layer + compliance/supply constraints, not a molecule-level WAC projection.
FAQs
1) Is oxyMORPHONE HCl likely to see net price growth?
Net price growth is generally unlikely in a managed-care and generic-competition context; expect compression unless the product retains preferred status with favorable contracting.
2) What matters more for forecasting oxyMORPHONE HCl pricing, WAC or net price?
Net price. In opioids, rebates, discounts, and chargebacks dominate realized economics.
3) How do IR vs ER formulations affect pricing outlook?
IR and ER products typically face different payer criteria, substitution patterns, and utilization management, so they should be forecast separately.
4) What event would most quickly change oxyMORPHONE HCl realized pricing?
A payer formulary decision that changes tier placement or imposes stricter PA/step edits, which typically forces rebate renegotiation.
5) How should substitution risk be handled in projections?
Model it as share drift to other long-acting opioids and to alternative active ingredients, with strength- and release-specific switching assumptions.
References
[1] https://www.fda.gov/drugs/drug-approvals-and-databases/drug-labeling
[2] https://www.accessdata.fda.gov/scripts/cder/daf/index.cfm
[3] https://www.deadiversion.usdoj.gov/faq/faq_controlled_substances.htm
More… ↓
