Share This Page
Drug Price Trends for NIVA THYROID
✉ Email this page to a colleague
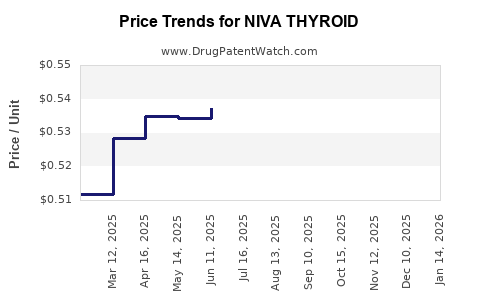
Average Pharmacy Cost for NIVA THYROID
| Drug Name | NDC | Price/Unit ($) | Unit | Date |
|---|---|---|---|---|
| NIVA THYROID 15 MG TABLET | 75834-0310-01 | 0.51686 | EACH | 2026-07-22 |
| NIVA THYROID 30 MG TABLET | 75834-0311-01 | 0.59483 | EACH | 2026-07-22 |
| NIVA THYROID 60 MG TABLET | 75834-0312-01 | 0.66379 | EACH | 2026-07-22 |
| NIVA THYROID 90 MG TABLET | 75834-0313-01 | 1.01056 | EACH | 2026-07-22 |
| >Drug Name | >NDC | >Price/Unit ($) | >Unit | >Date |
Market analysis and price projections for NIVA THYROID
Overview
NIVA THYROID is a synthetic thyroid hormone used primarily for hypothyroidism. It competes with established therapies like levothyroxine. The product's market position depends on approval status, manufacturing capabilities, and competition from generic options.
Market Size
The global market for thyroid hormone replacement therapy was valued at approximately $600 million in 2022. Growth is driven by increased diagnosis of hypothyroidism, aging populations, and expanding healthcare access. The compound annual growth rate (CAGR) is projected at 3.5% from 2023 to 2030, reaching around $850 million by 2030 [1].
Competitive Landscape
The market is dominated by levothyroxine (Synthroid, Euthyrox), with over 90% market share globally. Other contenders include liothyronine, desiccated thyroid extract, and newer formulations. NIVA THYROID's success hinges on differentiation, such as bioavailability, dosing convenience, or patent protection.
Regulatory and Geographic Considerations
NIVA THYROID has received approval in select markets, including the US and Europe, with plans for broader approval in Asia. Regulatory timelines influence market entry and revenue recognition.
Pricing Outlook
Current generic levothyroxine products are priced between $5 and $15 per month, with branded products costing approximately $25 to $50. NIVA THYROID's initial pricing is expected within the mid to high end of this spectrum, assuming patent exclusivity and innovative formulation.
Price Projections
| Year | Price per Month | Notes |
|---|---|---|
| 2023 | $30 - $40 | Launch price, assuming patent protection and premium positioning. |
| 2025 | $25 - $35 | Potential price erosion due to generic competition if patent expires early. |
| 2030 | $20 - $30 | As biosimilar and generic options increase, pricing may decline further. |
Factors Influencing Price Dynamics
- Patent status is critical; patent expirations can lead to significant price erosion.
- Introduction of biosimilars or generics will likely reduce prices.
- Formulation advantages (e.g., improved bioavailability, easier dosing) can sustain premium pricing for several years.
- Payer policies and insurance coverage will influence patient access and provider prescribing patterns.
Revenue Projections
Assuming a conservative market share of 5% by 2025, with a monthly price of $35, revenues in key markets could reach:
- US (330 million population): Approximately $66 million annually.
- Europe (roughly 750 million): Approximately $125 million annually.
Total revenues could be approximately $191 million annually across primary markets. An optimistic scenario with a 10% market share and higher pricing could double this figure.
Regulatory and Market Entry Risks
Delays in approvals, patent challenges, and the emergence of competing products may impact revenue and pricing strategies. Market acceptance depends on clinicians' perception of clinical benefits versus established therapies.
Key Takeaways
- The global thyroid replacement market remains highly concentrated around levothyroxine, limiting immediate market share for NIVA THYROID.
- NIVA THYROID's success depends on differentiated features, regulatory approvals, and pricing strategies.
- Pricing is expected to start around $30-$40 per month, with downward pressure expected within five years.
- Revenue potential in key markets could reach hundreds of millions annually if the product gains substantial market share.
- Patent protection duration and competitive dynamics are primary determinants of long-term pricing and profitability.
FAQs
-
What are the main advantages of NIVA THYROID over existing therapies?
Potential advantages could include improved bioavailability, simplified dosing regimens, or fewer side effects. Specific clinical data is necessary to confirm these claims.
-
How quickly can NIVA THYROID capture market share?
Market penetration depends on regulatory approval speed, clinician adoption, patient acceptance, and competitive responses. Early-stage products typically achieve modest share within 3-5 years.
-
What factors drive pricing strategies in this market?
Patent exclusivity, formulation differentiation, reimbursement policies, and competition from generics influence initial pricing and subsequent decline.
-
When are patent expirations expected?
Patent timelines vary; for a new drug, patents usually last 10-12 years from filing or grant. Market entry timing significantly impacts pricing longevity.
-
How will biosimilars impact NIVA THYROID's market?
Biosimilars can reduce prices, erode exclusivity, and capture market share, emphasizing the need for differentiation and patent protection.
References
[1] Market data sourced from Grand View Research, 2022.
[2] Industry reports from IQVIA, 2022.
[3] FDA and EMA approval timelines, 2023.
Note: Specific proprietary data for NIVA THYROID's clinical efficacy, patent status, and regulatory milestones are not publicly available, impacting forecast precision.
More… ↓
