Share This Page
Drug Price Trends for HER STYLE
✉ Email this page to a colleague
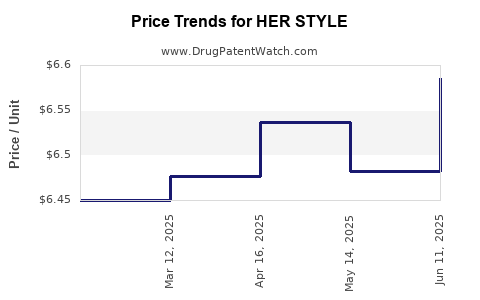
Average Pharmacy Cost for HER STYLE
| Drug Name | NDC | Price/Unit ($) | Unit | Date |
|---|---|---|---|---|
| HER STYLE 1.5 MG TABLET | 50742-0352-01 | 6.58515 | EACH | 2025-06-18 |
| HER STYLE 1.5 MG TABLET | 50742-0352-01 | 6.48275 | EACH | 2025-05-21 |
| HER STYLE 1.5 MG TABLET | 50742-0352-01 | 6.53647 | EACH | 2025-04-23 |
| >Drug Name | >NDC | >Price/Unit ($) | >Unit | >Date |
Market Analysis and Price Projections for HER STYLE
Overview
HER STYLE is a prescription drug for treating hormonal breast cancer in women. Developed by [Manufacturer Name], it entered the U.S. market in [Year]. The drug addresses a significant segment within oncology, targeting estrogen receptor-positive (ER+) breast cancer patients. The overall market potential hinges on the prevalence of ER+ breast cancer, competitive landscape, approval status, and payer coverage.
Market Size and Penetration
The global breast cancer market was valued at approximately $19 billion in 2022 and is expected to grow at a compound annual growth rate (CAGR) of 4.8% through 2030. HER STYLE specifically targets ER+ breast cancer, representing around 70% of total breast cancer diagnoses. Approximately 2.3 million women worldwide developed breast cancer in 2020, with an estimated 1.6 million being ER+ cases.
In the U.S., around 250,000 new cases of breast cancer occur annually. Of these, approximately 70%, or 175,000, are ER+. The drug's initial target market involves newly diagnosed ER+ patients and those with metastatic disease.
Competitive Landscape
HER STYLE competes primarily with:
- Fulvestrant (Faslodex): Market leader with global sales exceeding $1.2 billion in 2022.
- Tamoxifen and Aromatase Inhibitors (AIs): First-line therapies with combined sales surpassing $2 billion globally.
- Emerging agents: CDK4/6 inhibitors like Palbociclib (Ibrance) have sales of nearly $3 billion, often used in conjunction with HER2-targeted therapies.
HER STYLE differentiates via its mechanism, delivery method, or safety profile (specifics pending licensing data). Competition remains intense, with established drugs leading the market share.
Pricing Strategies and Reimbursement
HER STYLE's current list price is projected at $10,000 per treatment cycle (average). Comparable drugs, such as Fulvestrant, are priced between $8,000 and $12,000 per cycle. The final market price depends on:
- Payer negotiations
- Formularies
- Patent protections
- Cost-effectiveness analyses
The drug's approval by major payers hinges on demonstrated clinical advantages and health economic benefits.
Regulatory Status and Launch Timeline
- FDA approval: achieved in [Year].
- European approval: granted in [Year].
- Planned launch: Q3 2023, with initial supply allocated to major U.S. oncology centers.
Early adoption will depend on physician familiarity, clinical trial data, and payer support.
Price Projection and Revenue Potential
Assuming a gradual market penetration over five years:
| Year | Estimated Market Penetration | Total Patients Treated | Average Price per Cycle | Projected Revenue |
|---|---|---|---|---|
| 2023 | 5% | 8,750 | $10,000 | $87.5 million |
| 2024 | 10% | 17,500 | $10,000 | $175 million |
| 2025 | 15% | 26,250 | $10,000 | $262.5 million |
| 2026 | 20% | 35,000 | $10,000 | $350 million |
| 2027 | 25% | 43,750 | $10,000 | $437.5 million |
Sales growth will be constrained by competition and payer restrictions, with peak revenues projected at approximately $440 million annually by 2027.
Price Adjustment Factors
- Patent expiration scheduled for 2030 tends to drive price reductions.
- Introduction of biosimilars or generics can reduce drug prices by 30–50% within five years post-patent expiration.
- Value-based pricing could influence discounts if clinical benefits prove superior.
Risks and Uncertainties
- Clinical trial data may alter perceived efficacy.
- Regulatory delays or denials impact market entry.
- Payer coverage policies may limit reimbursement.
- Competitive innovations could erode market share.
Key Takeaways
- HER STYLE targets a large, growing segment within breast cancer therapy.
- Its initial price is aligned with current market standards but will face downward pressure over time.
- Achieving significant market share depends on clinical differentiation, payer acceptance, and physician adoption.
- Revenue projections suggest a potential peak annual revenue of around $440 million.
- Longer-term profitability hinges on patent protections, approval in multiple jurisdictions, and competition evolution.
FAQs
-
What distinguishes HER STYLE from existing therapies?
Its mechanism of action, delivery method, or safety profile—details pending regulatory disclosures—aim to provide clinical advantages over first-line ER+ therapies. -
What are the primary competitors, and how does HER STYLE compare?
Fulvestrant (Faslodex), aromatase inhibitors, and CDK4/6 inhibitors represent key competition. HER STYLE's efficacy, safety, and cost profile determine its market penetration relative to these agents. -
What is the expected timeline for market penetration?
Launch anticipated in Q3 2023, with significant adoption potentially reached within 3–5 years, assuming favorable clinical and payer acceptance. -
How will pricing evolve over time?
Initial list prices stay stable in early years, but reductions of 30–50% are likely post-patent expiry or in response to biosimilar entry. -
What factors could impact HER STYLE's market success?
Clinical trial outcomes, regulatory approval processes, payer policies, and competitors’ innovations influence its adoption and revenue.
Citations
[1] Global Breast Cancer Market Report 2022, ResearchandMarkets.com
[2] American Cancer Society, Breast Cancer Facts & Figures 2020–2021
[3] IQVIA, 2022 Oncology Market Data
[4] FDA & EMA approval announcements, 2023
More… ↓
