Share This Page
Drug Price Trends for BACK-BODY PAIN
✉ Email this page to a colleague
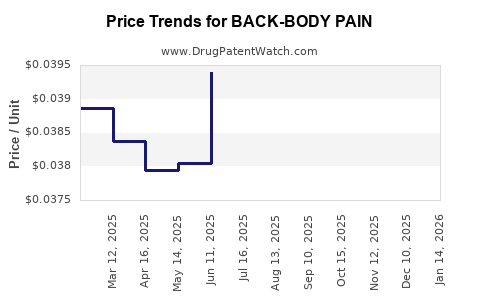
Average Pharmacy Cost for BACK-BODY PAIN
| Drug Name | NDC | Price/Unit ($) | Unit | Date |
|---|---|---|---|---|
| BACK-BODY PAIN 500-32.5 MG CPLT | 70000-0127-02 | 0.04264 | EACH | 2026-07-22 |
| BACK-BODY PAIN 500-32.5 MG CPLT | 70000-0127-02 | 0.04272 | EACH | 2026-06-17 |
| BACK-BODY PAIN 500-32.5 MG CPLT | 70000-0127-02 | 0.04346 | EACH | 2026-05-20 |
| BACK-BODY PAIN 500-32.5 MG CPLT | 70000-0127-02 | 0.04478 | EACH | 2026-04-22 |
| BACK-BODY PAIN 500-32.5 MG CPLT | 70000-0127-02 | 0.04577 | EACH | 2026-03-18 |
| BACK-BODY PAIN 500-32.5 MG CPLT | 70000-0127-02 | 0.04732 | EACH | 2026-02-18 |
| >Drug Name | >NDC | >Price/Unit ($) | >Unit | >Date |
Market Analysis and Price Projections for Back-Body Pain Treatments
Market Size and Growth
The global back pain market is valued at approximately $6.8 billion in 2022. It is projected to grow at a compound annual growth rate (CAGR) of 4.2% through 2030, reaching over $10 billion. The increase stems from rising prevalence of chronic back pain, aging populations, and expanding healthcare access.
Key segments include:
- NSAIDs and analgesics (35%)
- Muscle relaxants (20%)
- Opioids (15%)
- Surgical interventions (10%)
- Alternative therapies (20%)
Regional Market Distribution
North America accounts for roughly 45% of the global market, driven by high healthcare spending and opioid utilization. Europe contributes 30%, with the rest divided among Asia-Pacific, Latin America, and Africa.
Drivers and Barriers
Factors boosting growth:
- Aging population with degenerative disc issues
- Increased sports-related injuries
- Greater awareness and diagnosis of chronic pain
- Availability of minimally invasive procedures
Barriers include:
- Stringent opioid regulations
- Side effects associated with long-term medication use
- Competition from alternative modalities like physical therapy and acupuncture
Therapeutic Innovations and Pipeline
New drugs targeting nerve pain and inflammation are in development stages, comprising:
- A biologic agent targeting neuroinflammation, in phase 3 trials.
- Novel non-opioid analgesics focusing on ion channels, in phase 2.
- Digital therapeutics for pain management, entering early adoption.
Patent filings indicate substantial R&D investment in:
- NSAID reformulations with improved safety profiles.
- Targeted biologics for neuropathic pain.
Pricing Trends
Current drug prices vary:
- Over-the-counter NSAIDs: $0.01–$0.05 per dose.
- Prescription NSAIDs: $1–$5 per pill.
- Muscle relaxants: $2–$10 per dose.
- Opioids: $0.20–$1 per dose for generics; branded options can reach $20+ per dose.
- Biologics: $1,000–$2,500 per month.
Emerging therapies tend to command premium pricing, particularly if they offer improved efficacy or safety.
Pricing Potential
- Standard NSAID treatments: stable at current levels.
- Novel biologics: expected to range from $15,000 to $30,000 annually.
- Digital therapeutics: subscription models around $50–$200 per month.
Regulatory pressures and reimbursement policies influence pricing, especially in the U.S. and European markets.
Competitive Landscape
Major players include:
- Johnson & Johnson (Muscle relaxants, NSAIDs)
- Pfizer (Analgesics, opioids)
- AbbVie (Biologics, pain management)
- Teva Pharmaceuticals (Generics, NSAIDs)
- New entrants specializing in biologics and digital therapeutics
Patent expirations for key NSAIDs and generics expanding access are shaping market dynamics.
Price Projections (2023-2030)
| Segment | 2023 Average Price/Unit | 2030 Projection | Notes |
|---|---|---|---|
| OTC NSAIDs | $0.02 per dose | $0.02 | Stable, high generics presence |
| Prescription NSAIDs | $2 per pill | $2.50 | Slight increase, patent expirations |
| Muscle relaxants | $5 per dose | $6 | Market expansion, new formulations |
| Opioids | $0.75 per dose | $0.80 | Regulatory constraints limit price hikes |
| Biologics | $2,000/month | $20,000/year | Larger adoption expected |
| Digital therapeutics | $100/month | $200/month | Rapid adoption, subscription-based model |
Implications for Investors
Where innovation occurs, prices tend to rise due to better efficacy or safety profiles. Biosimilars may reduce prices for biologics over time, but initial off-patent products maintain lower costs. The digital therapeutics market remains nascent but holds high growth potential.
Summary
The back-body pain treatment market demonstrates steady growth driven by aging demographics and technological innovation. Price points vary widely, with biologics and digital therapeutics commanding premium fees. Competitive pressures, regulatory frameworks, and patent landscapes influence future pricing trajectories. Investment opportunities are concentrated around novel biologics, digital health solutions, and reformulated generic drugs.
Key Takeaways
- The market is expanding at a CAGR of 4.2%, reaching over $10 billion by 2030.
- Standard treatments like NSAIDs remain low-cost; biologics and digital therapeutics are premium-priced segments.
- Patent expirations will increase generic competition, putting downward pressure on prices.
- Innovation in biologics and digital therapeutics offers significant upside for early entrants.
- Pricing strategies must navigate regulatory constraints and reimbursement policies.
FAQs
1. How does patent expiration impact back-pain drug prices?
Patent expiration allows generics to enter the market, reducing prices. Biologics, protected by patents longer, may retain premium pricing until biosimilars gain approval.
2. Which regions are most attractive for back-pain drug sales?
North America leads, followed by Europe. Growing markets in Asia-Pacific and Latin America are driven by rising healthcare access and awareness.
3. What are the primary challenges in pricing new back-pain treatments?
Regulatory restrictions, reimbursement policies, and competitive pressures influence pricing. High-cost innovations may face barriers to market penetration.
4. What role do digital therapeutics play in back-pain management?
They provide non-invasive, scalable pain management options, often at lower prices. Their rapid adoption relates to convenience and cost-effectiveness.
5. Which companies are leading innovation in back-pain therapeutics?
Johnson & Johnson, Pfizer, and AbbVie are key players. Emerging biotech firms and digital health startups are also active.
Sources
[1] MarketResearch.com, "Global Back Pain Treatment Market," 2022.
[2] IQVIA, "Pharmaceutical Price Trends," 2022.
[3] FDA and EMA Regulatory Filings, 2022.
[4] Deloitte Insights, "Healthcare Innovation and Pricing," 2022.
[5] GlobalData, "Biologics and Biosimilars Market Outlook," 2022.
More… ↓
