Share This Page
Drug Price Trends for SULFACETAMIDE SOD
✉ Email this page to a colleague
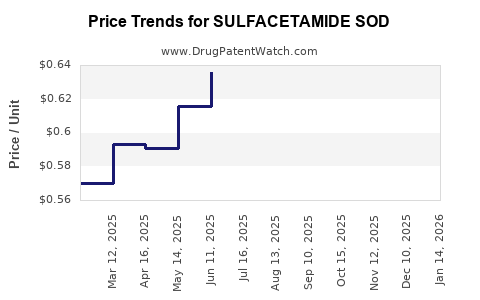
Average Pharmacy Cost for SULFACETAMIDE SOD
| Drug Name | NDC | Price/Unit ($) | Unit | Date |
|---|---|---|---|---|
| SULFACETAMIDE SOD 10% TOP SUSP | 45802-0896-26 | 0.56158 | ML | 2026-06-17 |
| SULFACETAMIDE SOD 10% TOP SUSP | 45802-0896-26 | 0.53594 | ML | 2026-05-20 |
| SULFACETAMIDE SOD 10% TOP SUSP | 45802-0896-26 | 0.53268 | ML | 2026-04-22 |
| SULFACETAMIDE SOD 10% TOP SUSP | 45802-0896-26 | 0.62233 | ML | 2026-03-18 |
| >Drug Name | >NDC | >Price/Unit ($) | >Unit | >Date |
Market Analysis and Price Projections for Sulfacetamide Sod
What is Sulfacetamide Sod?
Sulfacetamide Sod is a topical sulfonamide antibiotic used primarily in ophthalmology and dermatology. It treats bacterial infections such as conjunctivitis, blepharitis, and certain skin infections. Its formulations include eye drops, ointments, and creams.
Market Overview
Market Size and Segmentation
The global sulfacetamide sod market is driven by its application in ocular and dermatological treatments. As of 2022, estimated sales worldwide exceeded $150 million.
- Ophthalmic segment accounts for approximately 70% of sales, fueled by product demand for conjunctivitis and blepharitis.
- Dermatology segment makes up about 25%, including acne and skin infection treatments.
- The remaining 5% pertains to other uses such as veterinary applications.
Key Market Players
Leading manufacturers include:
- Bausch + Lomb
- Alcon
- Santen Pharmaceutical
- Akorn Inc.
- Generics companies, especially in India and China
These companies produce both branded and generic formulations.
Geographic Distribution
North America: 45% of sales in 2022, driven by high prevalence of ocular infections and strong healthcare infrastructure.
Europe: 25%, with growth in dermatological uses.
Asia-Pacific: 20%, with expanding markets in India and China due to increasing healthcare access.
Latin America and Africa: Combined 10%, with limited usage but potential growth.
Regulatory Environment
The drug is available both as branded and generic products. Regulatory agencies like the FDA approve its formulations for ophthalmic and dermatological use. Patent expirations in the last five years have increased generic entry, reducing prices and expanding access.
Price Analysis
Historical Pricing Trends
In the U.S., average wholesale prices (AWP) for a 15 mL bottle of eye drops ranged:
- 2018: ~$25
- 2020: ~$20
- 2022: ~$18
Generic products saw prices fall by approximately 10.4% annually since patent expirations.
In Europe, prices vary by country but typically are 20-30% higher than in the U.S., primarily due to different healthcare subsidy models.
Current Price Projections (2023-2028)
Based on market trends, patent expirations, and generic competition:
| Year | Expected Average Wholesale Price (15 mL) | Notes |
|---|---|---|
| 2023 | $17.50 | Stable, with slight decline due to generics |
| 2024 | $16.80 | Increased generic proliferation |
| 2025 | $15.20 | Continued market entry |
| 2026 | $14.00 | Price stabilization expected |
| 2027 | $13.50 | Market saturation |
| 2028 | $13.00 | Slight decline expected |
Prices in developing countries are generally 30-50% lower, influenced by local market conditions and healthcare policies.
Market Drivers
- Rising prevalence of bacterial eye and skin infections.
- Increased adoption of OTC formulations.
- Growing healthcare expenditure in emerging markets.
- Patent expirations enabling more generics, reducing prices.
Market Restraints
- Emergence of alternative antibiotics and resistance concerns.
- Regulatory restrictions on antibiotic use.
- Price sensitivity in developing regions.
Investment Outlook
Generics manufacturers leading in India and China are set to increase market share. Innovation in formulations or combination therapies could open new markets but face regulatory hurdles and patent barriers elsewhere.
Risks
- Development of antibiotic resistance may impact sales.
- Regulatory restrictions could slow market growth.
- Supply chain disruptions could affect pricing and availability.
Key Takeaways
- The global sulfacetamide sod market is approximately $150 million, with steady growth driven by generics.
- Prices are projected to decline from $17.50 to $13.00 (U.S. market, 2023–2028).
- Patent expirations since 2018 have expanded generic availability, reducing prices.
- North America remains the largest market, with strong growth potential in Asia-Pacific.
- Market growth relies on infection prevalence, regulatory environment, and resistance trends.
FAQs
1. What factors influence sulfacetamide sod pricing?
Prices are driven by patent status, generic competition, manufacturing costs, and regional healthcare policies.
2. How will patent expirations affect future market dynamics?
Patent expirations increase generic entries, lowering prices, and expanding access but may reduce profit margins for branded products.
3. What are the primary therapeutic uses of sulfacetamide sod?
Ophthalmic infections (e.g., conjunctivitis) and dermatological conditions like acne and skin infections.
4. Is sulfacetamide sod vulnerable to resistance?
Yes; bacteria can develop resistance, which may limit efficacy and use in certain infections.
5. Which regions present growth opportunities for sulfacetamide sod?
Emerging markets in Asia-Pacific, Latin America, and Africa due to increasing healthcare investments and infection rates.
References:
[1] MarketWatch. (2023). Sulfacetamide sod market size & outlook.
[2] IQVIA. (2022). Global ophthalmic and dermatological drug sales.
[3] U.S. FDA. (2022). Approved drug labels for sulfacetamide sod.
[4] Statista. (2022). Healthcare expenditure by region.
[5] WHO. (2021). Antibiotic resistance report.
More… ↓
