Before They Launch: The Competitive Intelligence Playbook for Generic and Biosimilar Market Entry
The day a competitor files a Paragraph IV certification against your lead molecule, you have 45 days to file suit […]
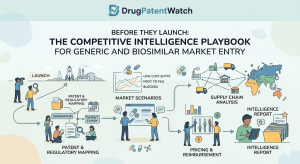
The day a competitor files a Paragraph IV certification against your lead molecule, you have 45 days to file suit […]
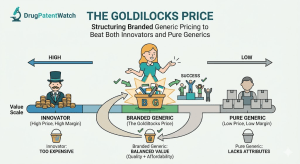
There is a narrow pricing band in pharmaceuticals where the math actually works. Price too high and payers route patients
Every blockbuster drug faces the same structural threat: the clock runs out on patent protection before the manufacturer has fully
A bottle of metformin 500 mg from Sun Pharma and a bottle of metformin 500 mg from a Tier-3 Indian
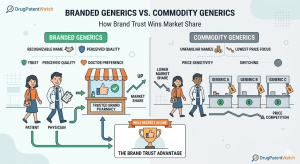
Branded Generics vs. Commodity Generics: How Brand Trust Wins Market Share Read Post »
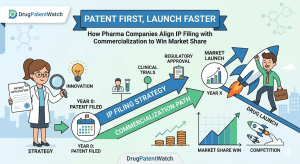
Every year, drug companies leave hundreds of millions of dollars on the table. Not because their molecules fail, not because
When Pfizer paid $11.6 billion for Array BioPharma in 2019, analysts praised the deal’s logic. Two years later, generic manufacturers
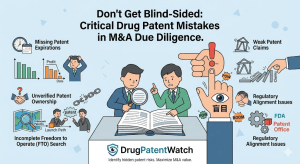
Don’t Get Blind-Sided: The Critical Drug Patent Mistakes to Avoid in M&A Due Diligence Read Post »
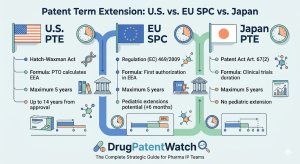
Ask anyone in pharma how long a drug patent lasts and they’ll say 20 years. The number is technically correct
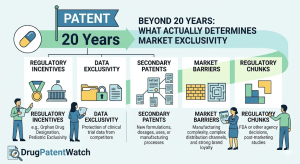
Beyond 20 Years: What Actually Determines a Drug’s Market Exclusivity Read Post »
When a buyer writes a $74 billion check for a drugmaker, they are not paying for the molecule. They are
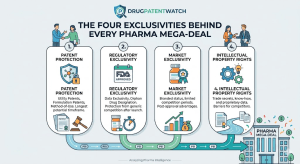
The Four Exclusivities Behind Every Pharma Mega-Deal Read Post »
Most pharmaceutical IP work gets framed as a pre-approval problem. File the composition patent during discovery, secure the use claims
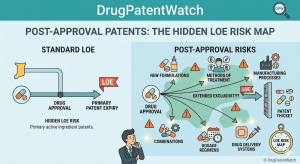
Post-Approval Patents: The Hidden LOE Risk Map Read Post »
Sign in or create a free account to read this DrugPatentWatch article
