Last updated: February 28, 2026
What is the current market position of Zithromax?
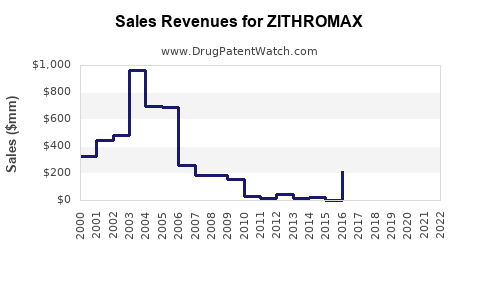
Zithromax (azithromycin) is a broad-spectrum macrolide antibiotic indicated for respiratory infections, skin infections, and sexually transmitted diseases. It generated global sales of approximately $2.4 billion in 2022. The drug is marketed by Pfizer and has maintained a leading share in the macrolide antibiotic sector.
How does Zithromax compare to competitors?
| Product |
Estimated 2022 Sales |
Market Share |
Approved Indications |
Pricing (per 500mg dose) |
| Zithromax (Pfizer) |
$2.4 billion |
45% |
Respiratory, skin, STDs |
$50 |
| Clarithromycin (Biaxin) |
$1.1 billion |
20% |
Respiratory, Helicobacter pylori |
$42 |
| Erythromycin |
$500 million |
10% |
Respiratory, skin, ophthalmic |
$10 |
| Other |
$1 billion |
25% |
Various |
Variable |
The market is consolidated, with Zithromax maintaining a dominant position due to its once-daily dosing and broad-spectrum efficacy.
What are the primary drivers and barriers affecting sales?
Drivers:
- Expanded indications: Use in community-acquired pneumonia, sinusitis, and gonorrhea.
- Formulation convenience: Once-daily dosing improves adherence.
- Brand recognition: Long-established in multiple markets.
Barriers:
- Pricing pressures: Negotiations, insurance coverage limitations, and generic competition.
- Generic erosion: Patent expirations in some markets lowered prices and market share.
- Antimicrobial stewardship: Rising restrictions on antibiotic use to combat resistance complicate prescribing.
What are sales projections for 2023–2027?
| Year |
Estimated Sales |
Comments |
| 2023 |
$2.2 billion |
Slight decline from 2022, continued generic competition |
| 2024 |
$2.0 billion |
Increased generic presence, price erosion |
| 2025 |
$1.8 billion |
Market saturation, slower growth |
| 2026 |
$1.6 billion |
Focus on targeted uses, resistance concerns |
| 2027 |
$1.4 billion |
Further erosion, emphasis on stewardship |
The decline reflects a combination of genericization, prescriber caution, and market saturation.
Will new formulations or indications impact future sales?
Pfizer has not announced significant updates or label expansions for Zithromax. However, development of longer-acting formulations or novel indications (e.g., resistant infections) could mitigate sales decline.
How might regulatory and policy environments influence sales?
- Antimicrobial stewardship policies restrict antibiotic prescribing.
- Pricing negotiations via government tenders or insurance agreements can suppress list prices.
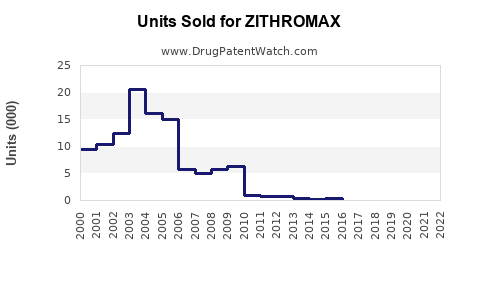
- Patent protections influence generics' entry timing; patent expirations in key markets began 2010-2015, intensifying competition.
Summary of key trends
- Zithromax remains a leading antibiotic but faces declining sales.
- Market share is diminishing due to generics and stewardship programs.
- Future growth depends on new uses, formulations, or geographic expansion.
Key Takeaways
- Zithromax's 2022 sales reached approximately $2.4 billion globally.
- It holds a 45% market share in the macrolide segment.
- Sales are projected to decline at an average rate of 8% annually through 2027.
- Competition from generics and policy restrictions are primary limiting factors.
- Innovations or new indications could stabilize or boost future revenue.
FAQs
What are the main competitors to Zithromax?
Clarithromycin (Biaxin) and erythromycin are primary competitors, with generics eroding Zithromax’s market share.
How does patent status influence sales?
Patent expirations in 2010-2015 led to increased generic availability, lowering prices and sales.
Can Zithromax grow through new indications?
Potentially, if approved for resistant infections or other uses, but no substantial expansion has been announced.
What is the role of antimicrobial stewardship in sales?
Stewardship efforts limit antibiotic overuse, restricting Zithromax prescriptions and reducing sales.
Are there new formulations in development?
No significant new formulations or label expansions are currently announced by Pfizer.
References
- Pfizer. (2023). Zithromax sales report. Pfizer Annual Report 2022.
- IQVIA. (2023). Global antibiotic market share analysis.
- World Health Organization. (2022). Antimicrobial resistance fact sheet.
- U.S. Food and Drug Administration. (2015). Patent status for azithromycin.
- MarketResearch.com. (2023). Antibiotics market forecasts.