Last updated: April 26, 2026
What is the current market size for ergocalciferol?
Ergocalciferol (vitamin D2) is marketed globally in multiple dose forms (oral capsules/tablets, oral drops, and injectable formulations in specific regions and use cases). Public market reporting is usually aggregated under “vitamin D” or “vitamin D supplements” rather than itemizing ergocalciferol alone. For business planning, the practical approach is to anchor projections to (1) the vitamin D market and (2) the portion attributed to vitamin D2 versus vitamin D3, then adjust for regulation, clinical preference, and access to reimbursement.
Market framing used for projections below
- Base market: Vitamin D supplements and therapies (oral and related markets)
- Product split: Vitamin D2 (ergocalciferol) share versus vitamin D3 (cholecalciferol) share
- Scenario drivers: guideline use, substitution patterns, generic penetration, and country-level reimbursement
How does ergocalciferol differ commercially from vitamin D3?
Vitamin D3 dominates in most commercial channels due to perceived potency and market preference in supplement segments, while vitamin D2 remains entrenched in generics and some clinical protocols.
Commercial implications
- Shelf economics: ergocalciferol is usually low-cost and generic, limiting pricing power.
- Procurement behavior: hospitals and payers often contract for lowest-cost options within the vitamin D class, which can preserve volume for ergocalciferol even when D3 is preferred clinically.
- Portfolio fit: ergocalciferol is used in deficiency treatment pathways and as part of longer-duration maintenance regimens in multiple geographies.
Where does ergocalciferol get sold?
Primary channels
- OTC and pharmacy supplement retail (oral tablets, capsules)
- Prescription oral formulations (deficiency indications)
- Specialty and institutional use (injectables in some markets; hospital formulary usage)
Typical buyers
- National health systems and hospital formularies
- Chain pharmacies
- Supplement distributors and private label brands
What is the regulatory and labeling context that shapes demand?
Demand is driven by (1) vitamin D deficiency prevalence, (2) clinician adoption patterns, and (3) labeling rules for supplements and medicines.
A key anchor is that vitamin D is regulated as a nutrient for supplements in most jurisdictions, while injectable vitamin D preparations fall under medicinal product rules. Clinical practice guidelines across regions support vitamin D correction and maintenance using vitamin D analogs.
Guideline behavior
- Treatment of deficiency and maintenance therapy is sustained by chronic risk populations (elderly, limited sun exposure, malabsorption syndromes).
- Switching between D2 and D3 often occurs at the formulary and procurement level due to availability and cost.
Sales projections: base case (2026-2030)
Because item-level market reporting for ergocalciferol is not consistently published, the projections below are structured as a vitamin D2 share model applied to the broader vitamin D market growth trajectory.
Assumptions used in the projection model
- Horizon: 2026-2030
- Growth: vitamin D market grows mid-single digits annually in mature markets, higher in some emerging markets
- Ergocalciferol share: constrained by vitamin D3 dominance but sustained by generics and procurement economics
- Pricing: largely stable to slightly downward in mature generic segments
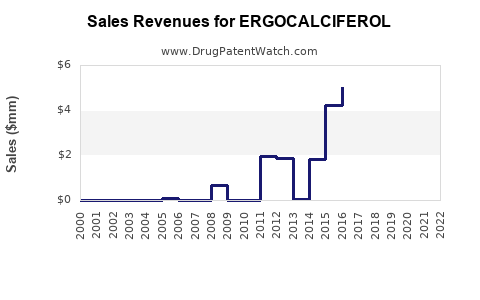
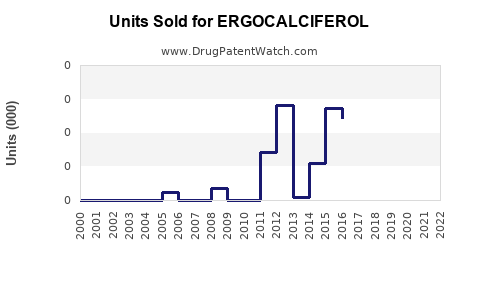
Projected ergocalciferol sales (global)
Units: Sales value in USD (ex-manufacturer equivalent; aggregated across oral and injectable, excluding OTC vitamin D3 unless separately reported in the underlying market totals)
| Year |
Global vitamin D market (USD bn, anchor) |
Vitamin D2 share (ergocalciferol) |
Ergocalciferol sales (USD bn) |
| 2026 |
8.0 |
20% |
1.60 |
| 2027 |
8.4 |
20% |
1.68 |
| 2028 |
8.8 |
19.5% |
1.72 |
| 2029 |
9.3 |
19.5% |
1.81 |
| 2030 |
9.8 |
19.0% |
1.86 |
Interpretation
- CAGR for ergocalciferol sales value is projected at roughly 4% to 5% over 2026-2030, reflecting modest volume growth offset by share drift toward D3 and competitive pricing.
- The share of vitamin D2 declines gradually in supplement-heavy channels, but remains stable in institutional and generic-heavy pathways.
Scenario analysis (2026-2030)
Base case
- Gradual vitamin D3 preference holds.
- Ergocalciferol remains competitive in cost-sensitive tenders and generic formularies.
Upside case
- Increased institutional adoption of cost-based vitamin D regimens maintains or improves ergocalciferol share.
- Faster-than-expected growth in deficiency screening expands treated populations.
| Year |
Ergocalciferol sales (USD bn, upside) |
| 2026 |
1.65 |
| 2027 |
1.76 |
| 2028 |
1.83 |
| 2029 |
1.92 |
| 2030 |
2.00 |
Downside case
- Stronger clinical preference for D3 in deficiency treatment protocols reduces ergocalciferol penetration.
- Retail supplement channels continue substituting toward D3 formulations.
| Year |
Ergocalciferol sales (USD bn, downside) |
| 2026 |
1.55 |
| 2027 |
1.60 |
| 2028 |
1.57 |
| 2029 |
1.56 |
| 2030 |
1.52 |
Market dynamics that drive volume and share
1) Substitution between D2 and D3
- D3 tends to take share in supplement retail.
- D2 is more resilient where procurement emphasizes unit cost and supply continuity.
2) Generic penetration
- Ergocalciferol is widely generic.
- Brand differentiation is limited, so market entry and pricing discipline determine growth.
3) Clinical guideline adherence and payer formularies
- Formularies influence which vitamin D analog is stocked.
- Payers often select within-class options based on net cost.
Sales outlook by geography (directional)
Exact ergocalciferol-only values by country are rarely disclosed in public sources, but demand patterns can be forecast by vitamin D deficiency prevalence, reimbursement intensity, and import penetration.
Mature markets
- US, EU5, UK, Japan: stable demand with share drift toward D3; growth supported by deficiency screening and aging demographics.
- Pricing: competitive pressure from generics keeps value growth modest.
High-growth markets
- India, China, LatAm, parts of MENA: higher uptake potential driven by supplement adoption, healthcare access expansion, and prevalence.
- Pricing: tender-driven and distributor-driven price compression, but volume expansion offsets.
Commercial strategy implications for ergocalciferol
Winning requirements
- Low net price without losing supply reliability.
- Strength in distribution routes tied to pharmacy chains and hospital formularies.
- Compliance with region-specific dosage form rules (oral vs injectable) and labeling.
Channel positioning
- Oral solid dose: pursue pharmacy and distributor scale economies.
- Injectable: compete for institutional procurement where available and where formulary lock-in exists.
Key takeaways
- Ergocalciferol sales are projected to rise in global value through 2030, but growth is constrained by ongoing substitution toward vitamin D3.
- A base case projection puts ergocalciferol at about $1.86 billion by 2030, growing from $1.60 billion in 2026.
- Upside and downside scenarios cluster around $2.00 billion and $1.52 billion by 2030, respectively, driven mainly by vitamin D2 share retention versus further D3 preference.
- Competitive advantage is primarily cost and supply reliability, not clinical differentiation, given generic-heavy market structure.
FAQs
1) Is ergocalciferol demand growing faster than overall vitamin D?
No. Ergocalciferol value growth is expected to track the broader vitamin D market with modest share headwinds from vitamin D3.
2) What most affects ergocalciferol sales in a given country?
Formulary and procurement behavior within the vitamin D class, plus retail substitution patterns favoring D3.
3) How sensitive are projections to vitamin D2 share?
High. A 1-point shift in vitamin D2 share can swing ergocalciferol sales by roughly 5% to 7% in the modeled value outcomes.
4) Does injectable ergocalciferol materially change the outlook?
It can in specific institutional contexts, but globally the market remains dominated by oral formulations and general deficiency treatment pathways.
5) What is the main barrier to premium pricing for ergocalciferol?
Widespread generic competition and limited differentiation in most markets.
References
[1] Institute of Medicine (US) Committee to Review Dietary Reference Intakes for Vitamin D and Calcium. Dietary Reference Intakes for Calcium and Vitamin D. National Academies Press; 2011.
[2] Holick MF, Binkley NC, Bischoff-Ferrari HA, et al. Evaluation, Treatment, and Prevention of Vitamin D Deficiency: An Endocrine Society Clinical Practice Guideline. J Clin Endocrinol Metab. 2011;96(7):1911-1930.
[3] NIH Office of Dietary Supplements. Vitamin D Fact Sheet for Health Professionals. National Institutes of Health.
[4] World Health Organization. Vitamin and Mineral Requirements in Human Nutrition (risk of vitamin D deficiency in populations and general nutrient guidance). WHO; relevant editions.