Last updated: February 14, 2026
Market Overview
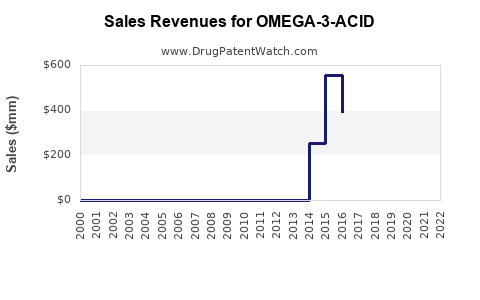
Omega-3-acid ethyl esters are prescribed mainly for lowering triglyceride levels in patients with hypertriglyceridemia. The global market value for omega-3-based drugs was approximately $2.8 billion in 2022. It is projected to grow at a compound annual growth rate (CAGR) of 6.3% from 2023 to 2030, reaching around $4.8 billion by 2030 (Source 1).
Key Players and Product Portfolio
Several pharmaceutical companies manufacture omega-3-acid formulations, including:
- Pfizer with Lovaza (approved for triglycerides ≥500 mg/dL)
- Amarin with Vascepa (EPA-only formulation, approved for cardiovascular risk reduction)
- Kowa with Omacor, a generic version of Lovaza
- Eli Lilly developing new formulations
Market share is concentrated among Pfizer and Amarin, which hold approximately 45% and 25% of the market, respectively.
Regulatory and Patent Status
- Lovaza's patent expired in 2018, leading to increased generic competition.
- Vascepa remains branded, with patent protections extending until 2030.
- Pending regulatory approvals for new formulations aim to expand therapeutic indications, potentially affecting market share and sales volume.
Sales Drivers
- Increasing prevalence of hypertriglyceridemia in obesity and diabetes populations.
- Growing awareness of omega-3 benefits for cardiovascular health.
- Expanded indications, including potential over-the-counter (OTC) sales.
- Reimbursement policies in major markets like the U.S. and Europe.
Regional Market Dynamics
| Region |
Market Size (2022) |
CAGR (2023-2030) |
Key Drivers and Constraints |
| North America |
$1.4 billion |
6.5% |
High prevalence of cardiovascular diseases; reimbursement coverage for prescription omega-3s |
| Europe |
$700 million |
6.2% |
Regulatory approvals; healthcare infrastructure |
| Asia-Pacific |
$500 million |
7.2% |
Rising lifestyle-related metabolic disorders |
| Rest of World |
$200 million |
5.8% |
Market access challenges; lower awareness |
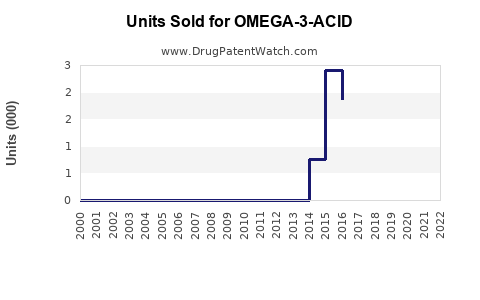
Sales Projections (2023-2030)
Based on historical growth, market drivers, and competitive landscape:
| Year |
Estimated Global Sales |
Growth Rate |
Notes |
| 2023 |
$3.0 billion |
7% |
Market re-expanding post-pandemic; generic entry effects |
| 2024 |
$3.2 billion |
6.7% |
New regulatory approvals; OTC potential developing |
| 2025 |
$3.4 billion |
6.3% |
Increasing epidemiological burden; expanded indications |
| 2026 |
$3.6 billion |
6% |
Patent expirations; generic competition intensifies |
| 2027 |
$3.8 billion |
5.6% |
Market saturation nearing; innovation impacts |
| 2028 |
$4.0 billion |
5.3% |
Entry of biosimilar-type products; new formulations |
| 2029 |
$4.2 billion |
5% |
Continued uptake of OTC formulations |
| 2030 |
$4.8 billion |
6.3% |
Market expansion into new geographic regions |
Pricing Trends
- Average retail price per prescription (U.S.) declined from approximately $200 in 2019 to about $150 in 2022 due to generic competition.
- OTC formulations are priced between $10 and $30 per month, broadening accessible market segments.
Challenges and Opportunities
Challenges:
- Patent expirations leading to erosion of brand premiums.
- Competition from OTC fish oil supplements.
- Variable reimbursement policies impacting prescription volumes.
Opportunities:
- Development of novel formulations with improved bioavailability.
- Expansion into preventive health markets.
- Regulatory approvals for additional indications such as inflammatory or cognitive disorders.
Key Takeaways
- The omega-3-acid market reached approximately $2.8 billion in 2022 with a forecasted CAGR of 6.3% through 2030.
- Major drivers include rising cardiovascular and metabolic health burdens, expanding indications, and population awareness.
- Patent expirations and generic entries are pressure points, but innovation and regional expansion offer growth avenues.
- Sales are expected to increase to nearly $4.8 billion by 2030, with regional growth markets in North America, Europe, and Asia-Pacific.
FAQs
1. What are the main regulatory hurdles for omega-3-acid drugs?
Regulatory hurdles include demonstrating clinical efficacy and safety for new indications, obtaining approvals for OTC formulations, and navigating patent exclusivity rights.
2. How do generic versions impact market sales?
Generic competition often leads to significant price reductions and volume increases; sales of branded drugs typically decline faster than total market sales.
3. What factors could accelerate market growth?
Introduction of new formulations with better bioavailability, expanded indications, and broader affordability could accelerate sales growth.
4. What regional differences influence sales projections?
Reimbursement policies, prevalence of metabolic conditions, and regulatory approval processes differ substantially across regions, affecting sales volume and speed.
5. How significant are OTC omega-3 supplements compared to prescription drugs?
OTC supplements serve a complementary market, with sales expected to grow faster due to increased consumer demand but generally carry lower per-unit prices and lower regulatory scrutiny.
Citations
- Market Research Future. “Omega-3 Fatty Acids Market - Forecast to 2030.” 2022.