Last updated: February 24, 2026
Hydrocodone is an opioid analgesic primarily used for pain relief and cough suppression. Its market size, regulatory landscape, and sales potential are influenced by public health concerns, regulatory changes, and emerging alternatives.
Market Overview
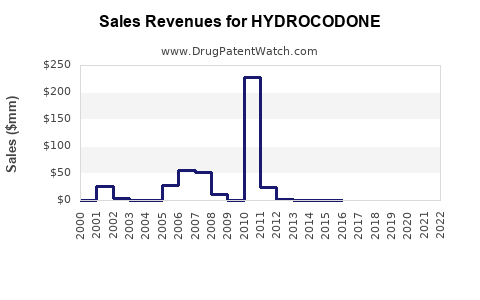
Hydrocodone ranks among the most prescribed opioids in the United States. In 2021, the drug generated approximately $4.2 billion in sales in the U.S., accounting for roughly 25% of the prescription opioid market. The North American market dominates globally, owing to high prescription rates and the prevalence of chronic pain conditions.
Regulatory Environment
In 2014, the U.S. Drug Enforcement Administration (DEA) reclassified hydrocodone combination products from Schedule III to Schedule II. This change increased regulations concerning prescribing, dispensing, and refill procedures. The reclassification aimed to curb misuse but also impacted prescription volumes and sales.
Recent legislative developments include:
- The implementation of Prescription Drug Monitoring Programs (PDMPs) limiting prescriptions.
- State-level restrictions and increased scrutiny on opioid prescribing.
- Set policies encouraging alternative pain management methods.
These regulations have tempered growth but haven't eliminated demand due to the ongoing need for effective pain management.
Market Segments
Prescription Segment
- Nearly 60% of hydrocodone sales derive from outpatient prescriptions.
- Key prescribers include pain clinics, hospitals, and primary care providers.
Generic vs. Branded
- Generic formulations constitute over 90% of sales, driven by lower costs and prescription preferences.
- Branded products account for less than 10%, primarily in specific formulations or combination products.
Formulation Types
- Immediate-release tablets dominate sales, with limited extended-release formulations approved.
- Combination products with acetaminophen or other agents account for most sales.
Competition
Hydrocodone faces competition from:
- Other opioids like oxycodone, morphine, and fentanyl.
- Non-opioid analgesics (NSAIDs, acetaminophen).
- Non-pharmacologic therapies (physical therapy, nerve blocks).
Market share concentration remains high among a few manufacturers, including Purdue Pharma, Alvogen, and Teva Pharmaceuticals.
Sales Projections
Short-term Outlook (Next 2 Years)
- Sales growth is modest, around 2-3% annually, driven by steady demand but constricted by regulatory measures.
- The trend toward alternative therapies may reduce prescription volumes slightly.
Mid-term Outlook (3-5 Years)
- Projected compound annual growth rate (CAGR) of 1-2% depending on policy shifts.
- Market saturation limits significant growth, especially as non-opioid therapies gain regulatory favor and insurance coverage improves for alternatives.
Long-term Outlook (Beyond 5 Years)
- Decline expected, around 1% annually, as the opioid epidemic prompts further restrictions.
- Development of abuse-deterrent formulations and new analgesic classes may decrease overall reliance on hydrocodone.
Potential Growth Drivers
- Expansion in emerging markets with rising healthcare infrastructure.
- New formulations with abuse-deterrent features.
- Increasing prevalence of chronic pain, particularly from aging populations.
Risks to Projections
- Stringent regulation and legislative bans.
- Legal challenges stemming from opioid litigation.
- Societal shifts favoring non-opioid pain management.
Key Data Summary
| Aspect |
Details |
| 2021 U.S. Sales |
$4.2 billion |
| Predominant Form |
Generic immediate-release tablets |
| Market Share |
25% of prescription opioids |
| Growth Rate (2022-2024) |
2-3% annually |
| Long-term Decline |
~1% annually beyond 2024 |
Key Takeaways
- Hydrocodone remains a major revenue contributor within pain management but faces declining growth prospects.
- Regulatory changes heavily influence prescribing habits and market size.
- Competition from non-opioid therapies and abuse-deterrent formulations poses long-term threats.
- Expected modest growth in emerging markets may offer new revenue streams.
FAQs
1. How will regulatory changes impact future hydrocodone sales?
Stricter prescribing rules and increased monitoring are expected to reduce sales growth. Universities and health agencies favor non-opioid alternatives, further constricting demand.
2. Are new formulations likely to boost sales?
Yes, formulations with abuse-deterrent properties could sustain or increase demand among prescribers and patients concerned about misuse.
3. Could legal actions influence sales?
Yes, ongoing opioid litigation may affect production or marketing practices, potentially leading to restrictions or increased liabilities.
4. What is the potential for growth in markets outside the U.S.?
Emerging markets with growing healthcare access present opportunities, but regulatory frameworks are less mature, which could create barriers.
5. How does competition from alternative therapies affect the market?
Alternative therapies, including non-opioid medications and non-pharmacologic treatments, could reduce reliance on hydrocodone over time.
References
- IMS Health. (2022). U.S. Prescription Opioid Market Data.
- DEA. (2014). Notice of Reclassification.
- CDC. (2021). Opioid Prescribing and Monitoring Report.
- Statista. (2022). Hydrocodone Sales Data.
- MarketWatch. (2023). Pain Management Drugs Market Outlook.
[1] U.S. Food and Drug Administration. (2022). Hydrocodone products: regulatory status and market trends.