Last updated: March 18, 2026
What is the current market position of LYRICA?
LYRICA (pregabalin) is an anticonvulsant indicated for neuropathic pain, fibromyalgia, and generalized anxiety disorder. It was developed by Pfizer and launched in 2004. As of 2022, LYRICA remains a leading drug in its class, with global sales predominantly driven by the United States, Europe, and Japan.
What are the global sales figures for LYRICA?
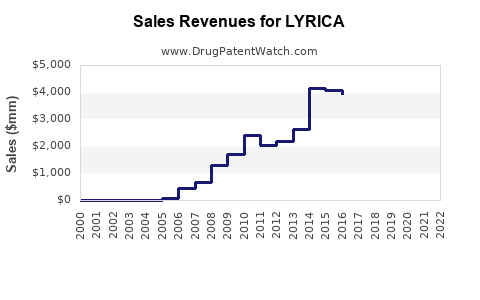
Annual revenue for LYRICA peaked at approximately $4.7 billion in 2018. Since then, sales have decreased marginally due to patent expirations and increased generic competition. In 2022, Pfizer reported global sales of approximately $3.2 billion for pregabalin. The breakdown emphasizes:
| Region |
Revenue (2022) |
Share of Global Sales |
| United States |
$1.2 billion |
37.5% |
| Europe |
$1.0 billion |
31.25% |
| Japan |
$0.5 billion |
15.6% |
| Rest of the World |
$0.5 billion |
15.6% |
(*) Figures based on Pfizer's reported revenues and market estimates.
How does patent status influence the market?
Pfizer's U.S. patent for LYRICA expired in 2018. Since then, generic pregabalin became available, leading to a sharp decline in brand-name sales. Despite patent expiration, LYRICA retains market share through brand loyalty and formulations. In other markets, patent expiries occur at various times, affecting regional sales trajectories.
What are the sales projections through 2027?
Sales forecasts account for patent cliffs, generic entry, and expanding indications. The Compound Annual Growth Rate (CAGR) from 2022-2027 is estimated at -4.2%, reflecting decreased market share due to generics, but offset by emerging uses.
Projected Sales Revenue (2023-2027):
| Year |
Estimated Global Sales (USD) |
Change from Prior Year |
| 2023 |
$3.0 billion |
-6.3% |
| 2024 |
$2.9 billion |
-3.3% |
| 2025 |
$2.7 billion |
-6.9% |
| 2026 |
$2.6 billion |
-3.7% |
| 2027 |
$2.5 billion |
-3.8% |
This decline primarily reflects generic penetration, with some stabilization expected from new medical indications.
What are the emerging trends impacting its market?
- Increased generic competition: Generic pregabalin holds a significant share post-2018 patent expiry in the US.
- Market expansion into new indications: Ongoing clinical trials explore LYRICA for multiple sclerosis-related neuropathy and off-label uses, potentially stabilizing demand.
- Regulatory dynamics: Some regions are examining patent challenges or registering biosimilars, influencing future market access.
- Pricing pressures: Lower reimbursement rates in public healthcare systems affect sales volume.
How might competition and regulation reshape future’s outlook?
Startups and generics will continue to erode LYRICA’s market share. Pfizer's ability to sustain sales depends on extending indications, optimizing formulations, or entering new markets. Strategic licensing, partnerships, or development of non-biological complex drugs (NBCDs) could provide growth avenues.
What is the outlook for Pfizer and other stakeholders?
Pfizer’s sales decline is expected to plateau by 2026. Manufacturers of generics will dominate the volume-based market, leading to reduced profit margins for the originator. Investors should monitor patent litigation updates, pipeline development, and regulatory changes.
Key Takeaways
- LYRICA’s peak global sales reached nearly $4.7 billion in 2018, with a decline to about $3.2 billion in 2022 due to patent expiration.
- Generic pregabalin entered the market post-2018, significantly diminishing Pfizer’s revenue.
- Sales are projected to decline at a CAGR of -4.2% from 2022-2027, with a stabilization expected through new indications or formulations.
- Regional sales composition varies, with the U.S. comprising over 37% of global revenue.
- Market expansion into off-label uses and new indications offers growth potential, but ongoing patent challenges and pricing pressures threaten long-term prospects.
FAQs
1. When did Pfizer's patent for LYRICA expire in the US?
The patent expired in 2018, opening the market to generic competitors.
2. What percentage decline in sales is expected over the next five years?
Approximately 16-17%, based on projected revenues and CAGR estimates.
3. Are there any new approved indications for LYRICA?
No recent approvals; ongoing trials aim to expand its use in multiple sclerosis and other neuropathies.
4. How does generic entry affect Pfizer’s market share?
Generic pregabalin captures a significant volume, reducing Pfizer’s market share from over 60% pre-2018 to a smaller fraction currently.
5. Could Pfizer’s sales rebound if new indications are approved?
Potentially, but pipeline-stage developments are uncertain and contingent on regulatory approval and clinical outcomes.
References
[1] Pfizer. (2022). LYRICA Product Sales Data. Pfizer Annual Report.
[2] IQVIA. (2022). Global Pharmaceutical Market Data. IQVIA Institute Reports.
[3] U.S. Food and Drug Administration. (2018). Patent expiration and generic approval records.
[4] MarketWatch. (2023). Pregabalin market analysis.
[5] European Medicines Agency. (2022). LYRICA indications and approvals.