Last updated: February 15, 2026
Overview
KARIVA (desogestrel/ethinyl estradiol) is a combined oral contraceptive approved for contraception in women. Its market presence depends on resistance from generics and competitive products, regulatory trends, and evolving consumer preferences.
Current Market Position
- FDA Approval: 1995
- Formulation: 28-day oral contraceptive pill
- Indication: Prevention of pregnancy
- Manufacturers: Originally made by Ortho-Med, now licensed to various generics manufacturers
- Pricing: Premium pricing initially, tends to decrease with generic entry
Market Dynamics
- Competitive landscape: The oral contraceptive market is highly competitive with brands like Yaz, Loestrin, and generics accounting for significant market share.
- Generic penetration: Generics account for approximately 85% of oral contraceptive prescriptions in the U.S. (IQVIA, 2022).
- Regulatory pressures: Potential for over-the-counter (OTC) switch influences future sales; FDA approval for OTC use remains under review.
Market Size
- U.S. prescription volume: Approximately 11 million prescriptions annually (IQVIA, 2022).
- Market value: Estimated at $1.2 billion, with branded products representing around 25% of sales.
Sales Trends
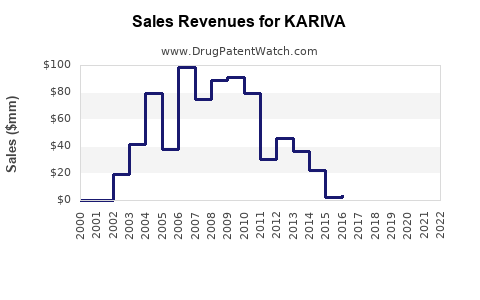
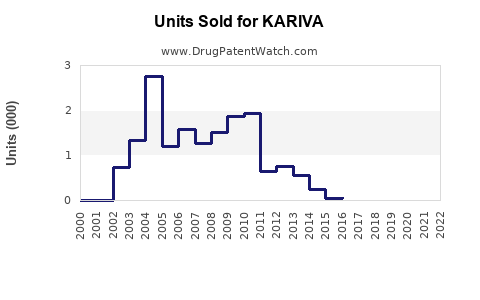
- Historical sales: Peaked around $250 million annually in the early 2000s; decline due to increasing generic competition.
- Current sales estimates: Around $50-70 million annually, depending on generic market share and regional sales variation.
Projected Sales Growth
| Year |
Scenario |
Assumptions |
Projected Sales (USD millions) |
| 2023 |
Baseline |
Continued generic competition limits brand growth; minimal OTC impact. |
50-55 |
| 2025 |
Moderate growth |
Possible OTC approval boosts prescriptions; some market expansion. |
65-70 |
| 2030 |
Optimistic |
Widespread OTC availability, improved access, potential inclusion in broader contraceptive options. |
80-100 |
Key Factors Influencing Future Sales
- Regulatory environment: FDA’s stance on OTC switch, potential impact on sales volume.
- Generic competition: The entrance of new generics and price erosion diminishes branded sales.
- Market preferences: Shift towards long-acting reversible contraception (LARC) devices may limit oral contraceptive demand.
- Regional expansion: Emerging markets could expand overall sales but typically favor generics and locally approved products.
- Advertising and brand loyalty: Limited marketing for branded products, typically driven by physician recommendation.
Regional Market Considerations
- U.S.: The largest market, with stable prescription flow but declining premium sales; OTC potential could alter dynamics.
- Europe: Similar competitive landscape, with some markets favoring locally manufactured generics.
- Emerging markets: Rapid growth potential but limited by local regulations and affordability concerns.
Concluding Summary
KARIVA's future sales are heavily influenced by generics and potential OTC approval. In the short term, sales are expected to remain stable at around $50-70 million annually. Medium-term projections indicate growth possibilities if regulatory and market conditions favor OTC switch or increased acceptance of oral contraceptives.
Key Takeaways
- KARIVA's sales have declined from peak levels due to generic competition.
- Current annual sales are approximately $50-70 million.
- Potential growth depends on OTC approval and demographic trends, with forecasts reaching up to $100 million by 2030 under optimistic scenarios.
- Market shifts favor long-acting contraceptives, impacting oral contraceptive demand overall.
- Regional dynamics and regulatory policies will shape future sales trajectories.
FAQs
1. How does the OTC switch impact KARIVA sales?
OTC availability could significantly increase sales volume by improving access, potentially turning prescriptions into over-the-counter sales. However, regulatory approval is uncertain and will depend on safety data and FDA determinations.
2. What impact do generics have on KARIVA's market share?
Generics dominate over 85% of the oral contraceptive market, exerting downward pressure on branded sales, including KARIVA.
3. Is KARIVA’s market growing or declining?
It is declining in absolute terms due to market saturation and shifts toward LARC devices but maintains steady sales in its niche.
4. What regions offer the best growth prospects?
Emerging markets, where contraception access expands, are likely to see growth, though demand is usually met with locally manufactured generics.
5. What factors could increase KARIVA’s market share?
Enhanced marketing, regulatory approval for OTC sales, and positioning as a preferred brand could improve share; however, competition remains stiff.
Sources
[1] IQVIA, 2022. U.S. Prescription Data.
[2] FDA, 2023. Contraceptive drug approval status.
[3] MarketResearch.com, 2022. Contraceptive Market Analysis.