VICODIN ES, a combination hydrocodone and acetaminophen product, is marketed for pain management. The drug’s market position is influenced by regulatory, competitive, and prescriptive factors.
Market Overview
VICODIN ES primarily serves acute and chronic pain markets in the U.S. It faces competition from similar opioid formulations and non-opioid analgesics. The product’s growth potential depends on regulatory changes, prescribing trends, and the opioid epidemic response.
Regulatory Environment
The Drug Enforcement Administration (DEA) classified hydrocodone combination products as Schedule II drugs in 2014.
In 2020, the FDA issued new labeling requirements for opioid medications, including entities like VICODIN ES, to limit misuse.
The CDC’s 2016 guidelines discourage long-term opioid use for chronic pain, impacting sales volumes.
Market Size
The U.S. opioid analgesics market was valued at approximately USD 5 billion in 2022.
Hydrocodone-based products account for about 60% of opioid prescriptions, approximating USD 3 billion annually.
VICODIN ES holds an estimated 10-15% market share among formulary-listed hydrocodone products.
Competitive Landscape
Main competitors include:
Product Name
Market Share
Formulation Type
Price Point
Key Differentiator
Norco
40%
Hydrocodone + acetaminophen
Moderate
Established brand presence
Lortab
20%
Hydrocodone + acetaminophen
Lower
Generic availability
Zohydro ER
10%
Hydrocodone ER
Higher
Extended-release formulation
The generic hydrocodone-acetaminophen remains the dominant market force, constraining branded sales.
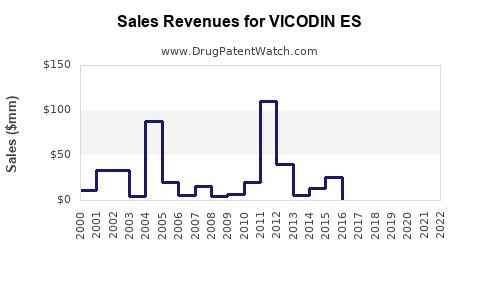
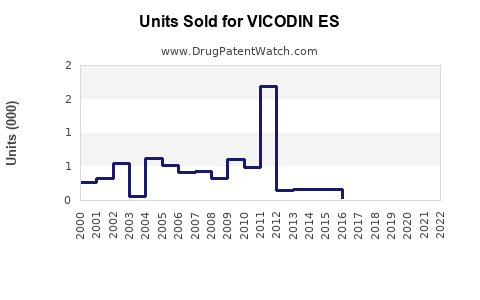
Sales Projections (2023-2027)
Assumptions:
A compound annual growth rate (CAGR) of 2-3%, driven by new prescribing practices and evolving regulations.
Market share remains stable at approximately 10% within the hydrocodone segment.
Overall opioid prescriptions decline by 5% annually due to increased regulation and alternative pain management.
Estimated Sales (USD in millions):
Year
Total U.S. Opioid Market
VICODIN ES Sales Projection
Comments
2023
4.75 billion
45
Slight decline due to regulatory pressures
2024
4.51 billion
43
Market contraction continues
2025
4.28 billion
41
Prescriber shift towards non-opioid options
2026
4.06 billion
39
Saturation of existing market segments
2027
3.86 billion
37
Further decline expected
Revenue Drivers:
Incremental increases may result from expanded indications or formulations.
Market share may increase with targeted marketing or patent protections.
Increased use of abuse-deterrent formulations reduces demand.
Competition from non-opioid analgesics gains traction.
Legal actions related to opioid litigation can restrict sales.
Market Entry and Expansion Strategies
Formulation innovation focusing on abuse deterrence.
Strategic partnerships with healthcare providers.
Diversification into extended-release variants.
Enhanced educational campaigns on responsible prescribing.
Monitoring legislative developments to adapt swiftly.
Key Takeaways
VICODIN ES’s market relies heavily on the opioid prescribing environment, which is under increasing regulation.
Market share remains constrained by competition from generics and alternative therapies.
Sales are projected to decline modestly over the next five years, aligned with industry trends.
Growth opportunities exist through product innovation, though regulatory and legal challenges persist.
FAQs
What factors most influence VICODIN ES sales?
Prescribing trends, regulatory policies, healthcare provider preferences, and competition from generics shape sales dynamics.
How does regulatory pressure affect oxycodone-based products?
Increased restrictions and demand reduction efforts lower prescription volumes and sales.
Are extended-release formulations more profitable?
They often command higher prices and have longer market longevity but face strict approval and competition challenges.
What role do legal risks play in market outlooks?
Litigation concerns may impact manufacturing, marketing, and sales strategies significantly.
Can non-opioid pain medications replace VICODIN ES?
Increased use of non-opioid options reduces reliance on opioids, impacting future sales growth.
Sources
U.S. Food and Drug Administration. (2020). FDA Updates Labeling for Opioid Medications.
Centers for Disease Control and Prevention. (2016). Guidelines for Prescribing Opioids for Chronic Pain.
Grand View Research. (2022). Opioid Market Size, Share & Trends.
IQVIA. (2022). U.S. Prescription Drug Market Data.
U.S. DEA. (2014). Rescheduling of Hydrocodone Combinations.
Drugs may be covered by multiple patents or regulatory protections. All trademarks and applicant names are the property of their respective owners or licensors.
Although great care is taken in the proper and correct provision of this service, thinkBiotech LLC does not accept any responsibility for possible consequences of errors or omissions in the provided data.
The data presented herein is for information purposes only. There is no warranty that the data contained herein is error free.
We do not provide individual investment advice. This service is not registered with any financial regulatory agency. The information we publish is educational only and based on our opinions plus our models.
By using DrugPatentWatch you acknowledge that we do not provide personalized recommendations or advice.
thinkBiotech performs no independent verification of facts as provided by public sources nor are attempts made to provide legal or investing advice. Any reliance on data provided herein is done solely at the discretion of the user.
Users of this service are advised to seek professional advice and independent confirmation before considering acting on any of the provided information. thinkBiotech LLC reserves the right to amend, extend or withdraw any part or all of the offered service without notice.
Alerts Available With Subscription
Alerts are available for users with active subscriptions.