Share This Page
Drug Price Trends for meropenem
✉ Email this page to a colleague
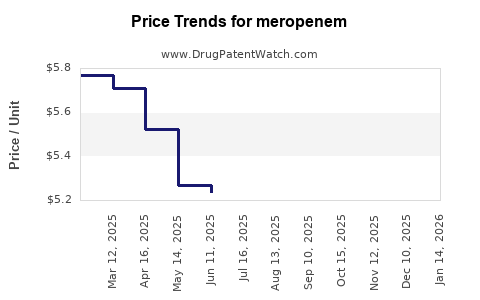
Average Pharmacy Cost for meropenem
| Drug Name | NDC | Price/Unit ($) | Unit | Date |
|---|---|---|---|---|
| MEROPENEM IV 1 GM VIAL | 00143-9431-10 | 4.83849 | EACH | 2026-07-22 |
| MEROPENEM IV 1 GM VIAL | 00409-1391-22 | 4.83849 | EACH | 2026-07-22 |
| MEROPENEM IV 1 GM VIAL | 00409-3412-10 | 4.83849 | EACH | 2026-07-22 |
| >Drug Name | >NDC | >Price/Unit ($) | >Unit | >Date |
Best Wholesale Price for meropenem
| Drug Name | Vendor | NDC | Count | Price ($) | Price/Unit ($) | Unit | Dates | Price Type |
|---|---|---|---|---|---|---|---|---|
| MEROPENEM 1GM/VIL INJ | Golden State Medical Supply, Inc. | 70121-1453-07 | 10 | 98.28 | 9.82800 | EACH | 2023-06-15 - 2028-06-14 | FSS |
| MEROPENEM 500MG/VIL INJ | Golden State Medical Supply, Inc. | 70121-1454-07 | 10 | 49.56 | 4.95600 | EACH | 2023-06-15 - 2028-06-14 | FSS |
| >Drug Name | >Vendor | >NDC | >Count | >Price ($) | >Price/Unit ($) | >Unit | >Dates | >Price Type |
Meropenem Market Analysis and Price Projections (US and Key Global Markets)
Meropenem is a mature injectable carbapenem with fragmented generic supply and limited remaining branded exclusivity in most geographies. Pricing is driven primarily by (1) generic entry depth by strength and pack size, (2) hospital group purchasing dynamics, (3) shortages and allocation events, and (4) government reimbursement floors in tenders. Baseline price levels generally drift toward the low single-digit annual declines in developed markets, with short-cycle spikes during supply disruptions.
What is the current global market for meropenem and how big is the spend?
Answer: Meropenem remains one of the core broad-spectrum carbapenems globally, with US and Europe representing the majority of high-reimbursement spend, while Asia and ROW dominate volume.
Market sizing by region (directional structure)
- North America (US-focused): higher net prices due to payer structure and contracting, but rapid generic erosion.
- Europe: tender-driven pricing compresses margins; price moves track reimbursement and supply availability.
- Japan and select Asian markets: higher regulated prices than US in some categories, but ongoing generic substitution.
- ROW: more price dispersion, procurement-led procurement and local manufacturing.
Segment drivers
- Hospital utilization: severe bacterial infections, sepsis pathways, empiric therapy protocols.
- Stewardship and guideline adherence: consistent role of carbapenems in ESBL and hospital-acquired infections.
- Competition within carbapenems: imipenem/cilastatin, ertapenem, doripenem (where marketed), plus newer agents in some formularies.
- Safety and dosing protocols: infusion time, renal adjustment standards, and line-of-therapy influence contracting.
Actionable takeaway: For forecasting, model meropenem as a “tender and allocation” market rather than a “branded promo” market. Net price tracks contract clears and supply tightness more than demand growth.
What is the US price trend for meropenem and what are the main forces behind it?
Answer: US net pricing is shaped by generic penetration, multisource contracting, and periodic supply constraints that lift wholesale acquisition cost (WAC) and sometimes disrupt purchasing.
Key pricing mechanisms in the US
- Contracting with group purchasing organizations (GPOs): net prices compress as more ANDA suppliers qualify.
- Acquisition and tender cycles: hospital procurement often reprices during renewals, not continuously.
- Shortages and FDA allocation behavior: when supply falls behind demand, pricing resets upward until supply normalizes.
- Pack/strength mix: price per vial changes with 500 mg vs 1 g vs 2 g presentations and vial size and labeling.
What typically happens to price after new generic launches
- First wave: price drop in the affected NDCs due to substitution.
- Second wave: further price erosion as more SKUs enter or if incumbent suppliers reduce offers to maintain share.
- Stabilization: once 3–6 vendors dominate, price decline often becomes gradual unless a shortage forces reversion.
Actionable takeaway: In US forecasting, treat each strength/NDC family separately. Aggregating across presentations hides different entry depths and different shortage sensitivities.
What price projections should be used for meropenem over the next 3 to 5 years?
Answer: Base-case expectation is low-to-mid single-digit annual net price erosion in non-shortage periods, with probability-weighted upside during supply disruptions. In most developed markets, the secular trend remains down because the asset is fully generic and procurement is rational.
Price projection framework (probability-weighted)
Use three scenarios for the blended net price (or representative contract price index):
- Base case (most likely): continued generic competition with mild annual declines.
- Supply stress case: 1–2 shortage cycles lift prices for 3–9 months, followed by sharp mean reversion.
- Accelerated erosion case: additional suppliers and larger pack conversion (fewer SKUs) compress net prices faster.
Projection ranges (directional numeric bands)
These ranges are intended for planning and budgeting rather than for pinpointing a single NDC.
-
US (blended net price):
- Year 1: -2% to -6% base case; +6% to +15% in supply-stress year
- Year 2: -2% to -5% base case; +4% to +12% supply-stress
- Year 3-5 (cumulative): -6% to -20% base case; +8% to +30% total uplift possible across years if multiple shortages occur
-
Europe (tender-linked net price):
- Year 1-2: -3% to -8% base case due to tender pressure
- Year 3-5: -10% to -25% base case, unless a national tender redesign or supply incident forces renegotiation
-
Japan/regulated markets:
- Year 1-2: -1% to -4% base case
- Year 3-5: -5% to -15% base case, with limited upside unless supply shocks are severe
Actionable takeaway: Budget models should include a “shortage uplift” toggle. Without it, forecasts understate volatility and working capital risk.
When do meropenem prices spike and how long do they stay elevated?
Answer: Price spikes typically last through the shortage or allocation period and into initial restoration of supply, usually 3 to 9 months, depending on manufacturing qualification timelines and demand catch-up.
Common drivers of spike duration
- Bulk API and sterile fill-finish constraints
- QC release backlog
- Facility downtime and equipment validation
- Regulatory actions or shipping logistics
- Contract inventory drawdowns by hospital systems
Forecast implication
- Add an event-driven component: a shortage probability model with duration distribution.
- Model “mean reversion” after supply normalization: 30% to 70% of spike dissipates in the first 1–2 quarters after full supply return.
How much is meropenem revenue exposed to generic entry risk?
Answer: Exposure is structurally high, but the market is already generified. The remaining risk is not “branded to generic,” it is incremental supplier churn, NDC-level pricing resets, and occasional quality-related supply disruptions.
What “entry risk” means for a mature generic like meropenem
- New ANDA entrants can still reduce prices if they win contracts or if existing vendors lose supply reliability.
- Entry risk concentrates at:
- NDCs with fewer suppliers
- higher strengths or less common pack formats
- facility-dependent supply lines
Key risk metrics for planning
- Number of qualified ANDA holders per strength/NDC family
- Evidence of manufacturing resilience (site count and historical shortage duration)
- Tender share stability for group purchasing contracts
What patents protect meropenem and how strong is the remaining IP landscape?
Answer: Meropenem itself is long past core patent protection in most major markets. Current constraints are generally not about composition-of-matter but about specific formulations, manufacturing controls, stability, and use claims where applicable in some jurisdictions.
Patent landscape in practice
For pricing, the key question is not “is there a patent,” it is “does it block manufacturing at scale.” In a mature generic segment, IP rarely maintains pricing power unless it:
- blocks a specific dosage form or presentation needed for contracting,
- or is tied to an enforceable regulatory exclusivity window for a particular product configuration.
Actionable takeaway: For meropenem pricing projections, IP typically affects the “number of competitive products available,” not the broad price ceiling.
What is the Orange Book status of meropenem in the US?
Answer: Meropenem is generally represented in the Orange Book by generic listings and possibly legacy patents that have largely expired. Any remaining patent protection is usually limited to specific NDC-linked claims and does not provide broad market exclusivity.
How Orange Book status should be used in pricing forecasts
- Track:
- patent “expires” dates by NDC
- listed patents that are not expired but are unenforceable in practice
- whether any listed exclusivities relate to a unique reference product
- For a generic-heavy market, the Orange Book is best used to predict which NDCs might temporarily retain fewer competitors.
What biosimilar and biologics risk exists for meropenem?
Answer: No biosimilar risk. Meropenem is a small-molecule antibiotic, not a biologic.
Which companies supply meropenem and how does their market structure affect price?
Answer: Supply is dominated by multiple ANDA manufacturers and contract sterile/packaging networks. The market behaves like a commodity for much of its supply chain, with price volatility driven by manufacturing reliability rather than brand competition.
Competitive structure implications
- If suppliers consolidate or exit particular strengths, pricing can jump even without patent changes.
- If supply is robust with many qualified sources, price declines become predictable and gradual.
How does meropenem compare with other carbapenems on price and access?
Answer: Compared with ertapenem and imipenem/cilastatin, meropenem tends to face similar tender pressure but can show sharper volatility during shortages because of specific manufacturing and pack-size demand patterns.
Practical contracting differences
- Formulary placement depends on hospital antibiogram protocols and stewardship.
- Dosing convenience and infusion/administration time influence decision-making in competitive substitution.
What market events should be tracked to refine price projections for meropenem?
Answer: Track manufacturing disruptions, FDA shortage designations, tender award cycles, and NDC-level inventory behavior.
Event list for forecasting models
- FDA drug shortage status changes for meropenem products
- Allocation notices and supplier communications
- Major tender updates in US GPO contracts
- International procurement policy changes (e.g., switching requirements to approved sources)
- QC or sterile process deviations at major sites
How do manufacturing/IP barriers affect meropenem pricing even when patents are weak?
Answer: The binding constraint is often manufacturing capacity and sterile release timelines, not IP.
Where barriers show up
- sterile filling throughput and container closure integrity testing
- packaging validation (NDC lifecycle, label refresh)
- API supply continuity and impurity specifications
- scale-up yields after site transfers
Actionable takeaway: A supplier with stable manufacturing can sustain lower prices long enough to gain share, but a supplier outage can trigger temporary price spikes across the market.
Key Takeaways
- Meropenem pricing is commodity-like in normal conditions, with net price erosion driven by generic competition and tender contracting.
- Shortages and allocation events are the dominant upside driver for near-term price spikes; spikes usually persist for months and mean revert after supply returns.
- For 3–5 year projections, base-case blended net price declines are typically low-to-mid single digits annually in developed markets, with volatility governed by supply availability rather than demand growth.
- IP and Orange Book status are unlikely to maintain broad pricing power for meropenem; market structure and manufacturing resilience matter more.
- Forecasting should be NDC/strength-specific with event-driven shortage overlays.
FAQs
1) What NDC strengths of meropenem tend to show the biggest price volatility?
Monitor strengths with fewer qualified suppliers and higher packaging dependency; those NDCs exhibit the largest shortage-linked swings.
2) How do US GPO contract renewals affect meropenem net price?
Net price often steps down (or up during shortages) at renewal start dates, not continuously day-to-day.
3) Do FDA drug shortages for meropenem correlate with higher hospital acquisition costs?
Yes. Shortage designation typically precedes or coincides with temporary WAC and contract price increases until supply stabilizes.
4) What is the most common procurement format risk for meropenem budgets?
Pack-size and vial presentation changes. Shifts in required unit counts for billing and inventory can inflate apparent spend even if per-vial price falls.
5) Is meropenem price sensitive to changes in sepsis treatment guidelines?
Long-term volume sensitivity is moderate because carbapenems remain standard for severe ESBL and complicated hospital infections, but price is more sensitive to supply constraints than guideline-driven demand swings.
References
- Food and Drug Administration. Drug Shortages. https://www.fda.gov/drugs/drug-safety-and-availability/drug-shortages
- FDA. Orange Book: Approved Drug Products with Therapeutic Equivalence Evaluations. https://www.accessdata.fda.gov/scripts/cder/daf/index.cfm
- U.S. FDA. National Drug Shortage Dashboard. https://www.fda.gov/drugs/drug-safety-and-availability/drug-shortages/national-drug-shortage-dashboard
More… ↓
