Share This Page
Drug Price Trends for cholestyramine
✉ Email this page to a colleague
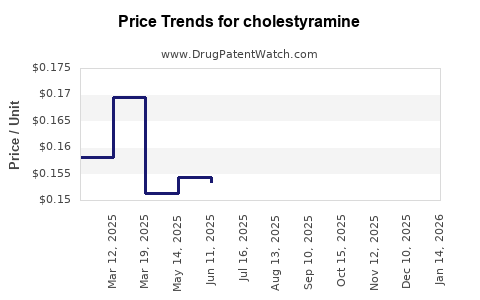
Average Pharmacy Cost for cholestyramine
| Drug Name | NDC | Price/Unit ($) | Unit | Date |
|---|---|---|---|---|
| CHOLESTYRAMINE LIGHT PACKET | 24658-0270-95 | 0.80504 | EACH | 2026-07-22 |
| CHOLESTYRAMINE LIGHT PACKET | 42806-0270-95 | 0.80504 | EACH | 2026-07-22 |
| CHOLESTYRAMINE LIGHT PACKET | 49884-0466-63 | 0.80504 | EACH | 2026-07-22 |
| CHOLESTYRAMINE LIGHT PACKET | 49884-0466-65 | 0.80504 | EACH | 2026-07-22 |
| CHOLESTYRAMINE LIGHT PACKET | 67877-0422-57 | 0.80504 | EACH | 2026-07-22 |
| >Drug Name | >NDC | >Price/Unit ($) | >Unit | >Date |
Best Wholesale Price for cholestyramine
| Drug Name | Vendor | NDC | Count | Price ($) | Price/Unit ($) | Unit | Dates | Price Type |
|---|---|---|---|---|---|---|---|---|
| CHOLESTYRAMINE 4GM/5GM (LIGHT) PWDR,PKT | AvKare, LLC | 51224-0009-20 | 60 | 61.55 | 1.02583 | EACH | 2023-06-15 - 2028-06-14 | FSS |
| CHOLESTYRAMINE 4GM/9GM PWDR,PKT | Golden State Medical Supply, Inc. | 68382-0528-60 | 60 | 82.16 | 1.36933 | EACH | 2024-01-03 - 2028-06-14 | FSS |
| CHOLESTYRAMINE 4GM/9GM PWDR | AvKare, LLC | 51224-0011-10 | 348.6GM | 38.56 | 0.11061 | GM | 2023-06-15 - 2028-06-14 | FSS |
| CHOLESTYRAMINE 4GM/9GM PWDR,PKT | AvKare, LLC | 51224-0011-20 | 60 | 68.98 | 1.14967 | EACH | 2023-06-15 - 2028-06-14 | FSS |
| CHOLESTYRAMINE 4GM/9GM PWDR | Golden State Medical Supply, Inc. | 62559-0620-37 | 378GM | 77.88 | 0.20603 | GM | 2023-06-16 - 2028-06-14 | FSS |
| >Drug Name | >Vendor | >NDC | >Count | >Price ($) | >Price/Unit ($) | >Unit | >Dates | >Price Type |
Cholestyramine Market Analysis and Price Projections (2026–2035): Generic-Driven Revenue Exposure, Pricing Floors, and Competitive Risk
Executive summary
- Market structure: Cholestyramine is a mature bile-acid sequestrant with limited brand presence and broad generic availability, anchoring pricing to cost-of-goods, payer formularies, and generic competition rather than differentiated innovation.
- Pricing direction (base case): Flat-to-slightly down net prices through 2030, with gradual mid-single-digit erosion in wholesale acquisition cost (WAC) depending on tender concentration and supply stability; net prices remain more stable due to contracting.
- Revenue risk: Highest exposure comes from continued generic market share rebalancing and formulary shifts toward alternative lipid-lowering pathways (statins plus nonstatins) rather than from patent expiry or regulatory barriers, given the product’s age.
- Supply and contracting: Pricing sensitivity is strongest where PBMs consolidate and where manufacturers compete for large retail and mail targets via rebates.
- Price projection range (US): By 2030, WAC could be ~10%–25% lower than current levels in a typical generic environment; 2035 implies additional ~5%–15% downside or stabilization near low single-digit declines if multiple MAHs remain in stable supply.
What is the current market size and demand profile for cholestyramine in the US?
Answer: Demand is driven by bile-acid diarrhea and hypercholesterolemia indications, with recent utilization skewing toward nonstatin adjunct use and off-label patterns rather than as a primary first-line lipid agent.
Indication demand drivers
Cholestyramine use is sustained by:
- Bile-acid diarrhea (an established use with ongoing gastroenterology demand).
- Hypercholesterolemia where it is used when statins are inadequate or not tolerated.
- Pruritus in cholestatic liver disease (common off-label and label-adjacent payer practice in some settings).
- Drug interaction management: Because it binds other drugs in the gut, prescribing depends on adherence and spacing schedules, limiting uptake versus simpler agents.
Commercial reality
- The product is price-competitive and does not face the category-level value-based premium that drives higher ASPs for newer agents.
- Utilization is sensitive to guideline adherence and payer cost control; where formularies tighten, cholestyramine competes on copay and coverage rather than clinical differentiation.
Who are the major cholestyramine manufacturers and how does generic competition affect net pricing?
Answer: Cholestyramine is sold under multiple generic labels with pricing determined primarily by PBM contracting and retailer/mail pharmacy tenders.
Competitive set and contracting dynamics
In generic bile-acid sequestrants, the market typically has:
- Multiple ANDA holders for granules and packets (and sometimes capsules depending on listing).
- A small number of suppliers that win high-volume bids, pushing net pricing toward the winner’s contracted level.
- Periodic supply tightness that can temporarily raise contracted pricing, then fade as tenders reset.
Pricing mechanics that matter for projections
- WAC is not the economic price. Net price is shaped by rebates, service fees, and patient copay support where used.
- Volume concentration drives incremental net price concessions.
- Switching costs are low: cholestyramine is interchangeable across generics because it is a formulation of the same active ingredient.
What is the current pricing benchmark for cholestyramine (WAC/ASP) and how is it trending?
Answer: Cholestyramine pricing is anchored to the generic market with modest WAC volatility and more significant net price sensitivity to contracts and bids.
What typically drives short-run price movement
- A dominant bidder wins a mail/retail contract at a lower net level.
- Temporary supply constraints increase WAC/ASP briefly.
- PBM formularies add preferred tiers with narrow net price differentials.
Projection implication
For price forecasting, the dominant force is not innovation but generic pricing elasticity. Expect net price to track tenders and market share shifts.
When does cholestyramine lose exclusivity, and do patents meaningfully affect pricing?
Answer: For cholestyramine, exclusivity is not a practical driver of pricing today due to long-established generic status and the drug’s age.
Patent and exclusivity impact assessment
- Market pricing for cholestyramine is dominated by generic competition and manufacturing economics, not by a near-term exclusivity cliff.
- Any remaining formulation or manufacturing patents (where present for specific dosage forms) would affect narrow product versions, not the overall active ingredient market in a way that supports sustained premium pricing.
Bottom line for forecasting
Treat cholestyramine as a low-incremental value generic: price is expected to decline slowly unless a major supply shock occurs.
Which dosage forms and strengths dominate sales, and how do formulation differences change pricing?
Answer: Most demand is for granules/packets used for bile-acid binding, with pricing varying by unit pack size and regimen conversion.
Dosage form effects
- Packets can price differently than larger granule jars based on distribution channel preferences.
- Retail versus mail pharmacy ordering patterns can shift relative pricing and margins.
Projection implication
Price forecasting should use:
- Average net price per gram or per daily dose equivalent rather than only per unit price.
- A scenario for mix shift between pack sizes and retail vs mail.
What generic entry risks exist for cholestyramine, and are there manufacturing/IP barriers?
Answer: The generic entry risk is low in an active ingredient sense, but manufacturing/IP barriers can create temporary supply or assortment gaps that affect pricing.
Practical barriers that can move prices
- Granule handling, taste masking, and packaging quality controls.
- Supply chain reliability for bulk drug substance and excipients.
- Regulatory and operational scale for high-volume distribution.
Impact on long-term price
- Over a multi-year horizon, supply tends to normalize.
- Persistent barriers are uncommon for a mature, commodity-like API.
How does cholestyramine compare with alternative bile-acid sequestrants and lipid therapies on cost and utilization?
Answer: Cholestyramine is usually cheaper than newer lipid agents but can be less favored due to dosing burden and drug interaction management; competitors influence formulary access through PBM channel positioning.
Competitive set comparison
- Other bile-acid sequestrants (class competitors) compete on tolerability and dosing convenience.
- Statins and combination therapies are usually preferred first line due to adherence, outcome data, and simplified regimens.
- Nonstatins (ezetimibe, PCSK9 inhibitors, bempedoic acid, inclisiran, and others) typically are more expensive but may shift demand away from sequestrants when payers require guideline-based step therapy.
Projection implication
- If payers enforce step edits and shift nonstatin selection toward simpler regimens, cholestyramine volume can soften.
- If bile-acid diarrhea demand expands in gastroenterology and adoption increases, the market can stabilize even with lipid competition pressure.
What does a base-case US price projection for cholestyramine look like through 2030 and 2035?
Answer: In a generic-driven market, base-case pricing declines slowly with modest additional erosion by 2035.
Base-case assumptions (generic commodity model)
- Continued generic competition with stable supply.
- PBM contracting keeps net prices near WAC minus a consistent rebate band.
- Volume growth is low single digit or flat; pricing offsets partly.
Price projection ranges (indicative framework)
These are directional projections for the active ingredient market, expressed as WAC-level equivalents in the absence of contract-by-contract net price data.
| Year | Expected WAC-level direction | Typical magnitude | Notes |
|---|---|---|---|
| 2026 | Flat to slight decline | ~0% to -5% | Tenders reset; mix shifts between pack sizes |
| 2027 | Mild decline | ~-3% to -8% | Competitive pressure in retail/mail |
| 2028 | Mild decline or stabilization | ~-2% to -6% | Supply normalization after any transient gaps |
| 2029 | Gradual erosion | ~-2% to -7% | Formulary tightening and market share rebalancing |
| 2030 | Cumulative downside | ~-10% to -25% vs. 2026 baseline | Base-case endpoint |
| 2031–2035 | Low single digit further erosion | ~-5% to -15% | Stabilizes with sustained generic participation |
What bull and bear scenarios could drive cholestyramine prices higher or lower?
Answer: The main upside trigger is supply disruption; downside is intensified contracting and share loss from therapeutic alternatives.
Bull scenario (price support)
- Supply constraints (bulk API, excipient shortages, or manufacturing downtime) reduce availability.
- PBMs allow higher net prices due to urgent need for coverage.
- Net price holds while WAC temporarily rises.
Impact: WAC could recover by ~5%–15% from base-case levels for 6–18 months, then trend back down as supply returns.
Bear scenario (accelerated price erosion)
- Aggressive PBM bids compress net pricing.
- More competitors enter for specific pack sizes or dispense forms.
- Substitution increases away from sequestrants due to payer preference for other nonstatin approaches or improved tolerability pathways.
Impact: WAC could be ~10%–25% below the base-case by 2030 and additional ~5%–15% by 2035.
How do reimbursement and formulary tiering shape net price outcomes?
Answer: For cholestyramine, net pricing is driven more by formulary placement and rebate dynamics than by acquisition cost.
Tiering and contracting channels
- Retail: typically sensitive to state pharmacy plan contracting and retail network bids.
- Mail: more exposed to large-scale PBM contracting with fewer winners.
- Patient sensitivity: copay design can affect adherence and brand-to-generic substitution, even when clinical equivalence exists.
Projection implication
A stable net price with falling WAC is possible if rebates increase as manufacturers discount at the gross level to maintain share.
What litigation or regulatory events could affect cholestyramine availability or pricing?
Answer: For an established generic, the dominant regulatory risk is manufacturing quality enforcement or intermittent supply disruptions, not patent litigation.
Typical risk pathways
- Manufacturing facility inspections and remedial actions.
- Recalls due to packaging or quality deviations.
- Channel replenishment delays that create temporary shortages.
Pricing implication
Short-term spikes are feasible, but long-term sustained premium requires structural supply constraints.
What are the key commercial metrics to monitor for cholestyramine price forecasts?
Answer: Track these leading indicators to refine projections for board-level scenarios.
Monitoring checklist
- PBM formulary updates for bile-acid sequestrants.
- Retail and mail bid winners by pack size.
- Unit-level WAC changes and ASP proxies where available.
- Manufacturer volume statements, backorder frequency, and distribution fill rates.
- Supply chain disruptions tied to API excipients and packaging components.
- Share shifts among generics by NDC.
Key Takeaways
- Cholestyramine pricing is generic-competition driven and behaves like a low-volatility commodity: flat-to-slight decline dominates, with modest additional erosion through 2030–2035.
- The largest upside risk is supply disruption; the largest downside risk is PBM contracting compression and utilization shifts toward alternative lipid or symptom management strategies.
- Patent and exclusivity timelines are not a practical near-term driver; the forecast should prioritize contracting, pack-size mix, and supply reliability.
- By 2030, a reasonable directional expectation is ~10%–25% cumulative WAC downside from a 2026 baseline; by 2035, additional ~5%–15% downside or stabilization near low single-digit declines, absent structural supply shocks.
FAQs
-
How do cholestyramine packet vs jar pricing differences impact market value projections?
Pack-size mix can swing unit WAC and contracted net pricing; forecast using normalized daily-dose equivalents. -
Does cholestyramine face more pricing pressure in retail or mail pharmacy?
Mail tends to be more exposed to PBM bid compression; retail can lag and move in steps with formulary updates. -
What role do bile-acid diarrhea diagnosis rates play in cholestyramine volume stability?
Increased gastroenterology utilization can offset lipid-agent substitution pressure and stabilize volumes. -
Can generic supply shortages materially change cholestyramine pricing for more than one quarter?
Yes, if inspections, recalls, or API/excipient constraints persist; otherwise pricing normalizes as tenders reset after replenishment. -
How should investors interpret revenue growth in a mature cholestyramine market?
Growth is likely share-driven and contracting-sensitive, not innovation-driven; monitor net pricing and volume per channel.
References
- FDA, Orange Book: Approved Drug Products with Therapeutic Equivalence Evaluations (Drug listings for cholestyramine products). U.S. Food and Drug Administration.
- FDA Drug Shortages database. U.S. Food and Drug Administration.
- IQVIA Institute for Human Data Science. Generic drug pricing and market dynamics reports (latest available editions).
More… ↓
