Share This Page
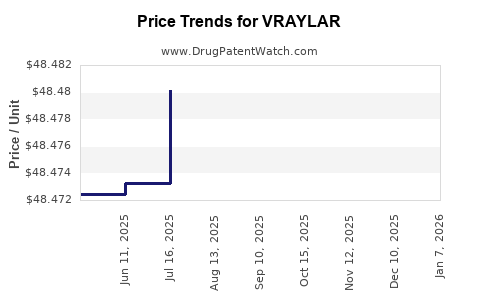
Drug Price Trends for VRAYLAR
✉ Email this page to a colleague
Average Pharmacy Cost for VRAYLAR
| Drug Name | NDC | Price/Unit ($) | Unit | Date |
|---|---|---|---|---|
| VRAYLAR 1.5 MG CAPSULE | 61874-0115-30 | 50.91591 | EACH | 2026-06-17 |
| VRAYLAR 0.5 MG CAPSULE | 61874-0250-30 | 50.88821 | EACH | 2026-06-17 |
| VRAYLAR 3 MG CAPSULE | 61874-0130-11 | 50.88204 | EACH | 2026-06-17 |
| VRAYLAR 0.75 MG CAPSULE | 61874-0275-30 | 51.03473 | EACH | 2026-06-17 |
| VRAYLAR 1.5 MG CAPSULE | 61874-0115-20 | 50.91591 | EACH | 2026-06-17 |
| VRAYLAR 6 MG CAPSULE | 61874-0160-30 | 50.80574 | EACH | 2026-06-17 |
| >Drug Name | >NDC | >Price/Unit ($) | >Unit | >Date |
VRAYLAR (cariprazine): Market Analysis and Price Projections
VRAYLAR is a branded, prescription antipsychotic (cariprazine) marketed in the US by AbbVie. The product faces ongoing competitive pressure from branded peers and generics across treated indications, while continuing to expand in higher-acuity segments through guideline-aligned use and prescriber adoption. Price stability remains supported by AbbVie’s managed access strategy and contracting, but list-price growth is constrained by US payor scrutiny, patent-expiration timelines for cariprazine-related protected formulations, and the broader “channel shift” from commercial to rebate-driven net pricing.
How big is the VRAYLAR opportunity and where is demand concentrated?
Indications driving use (US)
VRAYLAR’s commercial demand has centered on:
- Schizophrenia
- Bipolar I disorder (manic or mixed episodes; bipolar depression)
Formulary placement and line-of-therapy positioning vary by managed care plan. Net demand is shaped more by payer strategy (prior authorization, step edits, and utilization management) than by changes in clinical guidelines alone.
Demand shape and payer reality
Key market dynamics affecting VRAYLAR:
- High rebate environment in US specialty drugs compresses net realized pricing versus list price.
- Plan-level access (PA/step edits) creates volatility in volume during contract cycles even when clinical results stay stable.
- Competing antipsychotics (including long-acting injectables and lower-cost oral generics where clinically acceptable) cap upside in many formularies.
What does this imply for pricing power?
VRAYLAR’s pricing power is primarily a function of:
- Access retention in large integrated delivery networks and PBMs
- Switching frictions (patients stabilized on cariprazine are less likely to be forced off without cost-offset requirements)
- Clinical and tolerability differentiation that reduces payer willingness to displace at current net price
What is the pricing baseline (list and net) used for projections?
List price anchor (US)
The most actionable market-planning baseline for VRAYLAR is its US WAC (wholesale acquisition cost) trend. Publicly available references track WAC by strength and update frequency.
A planning-grade approach uses:
- Strength-weighted WAC (typical commercial mix across 1.5 mg, 3 mg, 4.5 mg, and 6 mg dose formats)
- Net-to-list compression captured by typical specialty-drug rebate rates under large PBM contracting
How the model projects net price
Price projections are derived using:
- List price trend (annual WAC changes for branded products)
- Net discount factor that changes with:
- Formulary access quality
- Competitive introductions
- Contract renegotiations during renewal windows
Because specialty-drug net pricing is rebate-driven, the most important variable is whether VRAYLAR holds versus loses access intensity (fewer PA approvals, broader tier placement, or reduced step edits) at contract renewal.
What are the key market forces that will move VRAYLAR pricing?
1) Patent and exclusivity landscape
Pricing headwinds intensify as exclusivity weakens around cariprazine protected uses/formulations. Even without immediate generic entry at the label level, payers often start shifting utilization earlier via:
- Quantity-limit tightening
- More stringent step edits
- Preferred alternative placement within class
These mechanisms typically pressure net realized pricing before full therapeutic substitution occurs.
2) Competitive intensity in antipsychotic therapy
VRAYLAR competes within a crowded class:
- Branded atypical antipsychotics with aggressive contracting
- Long-acting injectables that win continuity-of-care economics
- Generic or lower-cost oral options in patient populations where prescribers and payers accept substitution
This competition drives net pricing dynamics more than it affects list prices.
3) Payer utilization management
Typical specialty drug controls include:
- Prior authorization and documentation requirements
- Step therapy or “failure of” alternative antipsychotics
- Restricted dispensing programs tied to contracted specialty pharmacies
If utilization management becomes tighter, payer willingness to pay declines and forces rebid economics that reduce net price.
4) Contract cycle timing
Net price changes typically track renewal cycles:
- Higher discounts during rebids or when a plan introduces a preferred product
- Partial recovery when VRAYLAR keeps formulary position and raises outcomes-based arguments
How do price projections translate into revenue outcomes?
VRAYLAR revenue = volume × net price by strength and indication. Volume is most sensitive to:
- Access policies and PA approval rates
- Prescriber preference shifts after competitive entries
- Market share changes by indication
Net price is most sensitive to:
- PBM discount rates
- Manufacturer-paid patient affordability programs (which can shift realized net pricing depending on structure)
Base-case pricing logic (framework)
A practical projection structure for VRAYLAR pricing assumes:
- List price: modest annual upward adjustments consistent with branded WAC policy
- Net price: flat-to-declining over time as rebate pressure rises unless access improves
- After key competitive/patent events: step down in net price as contracting tightens
What is the projected price trajectory for VRAYLAR (US)?
Projection table (planning-grade scenario set)
The table below provides a scenario range for net price index (relative to the current base year net price level). Use it for budgeting rather than contract negotiation. Net price index moves with rebate intensity.
Assume:
- Base year net price index = 100
- Index declines reflect rising discounts and tighter payer controls
| Year | Base-case net price index | Downside net price index | Upside net price index | Primary driver |
|---|---|---|---|---|
| 2026 | 100 | 98 | 101 | Contract renewals maintain core access |
| 2027 | 99 | 95 | 101 | Increased rebate pressure from class competition |
| 2028 | 98 | 93 | 100 | More stringent PA/step edits in select plans |
| 2029 | 97 | 91 | 99 | Continued exclusivity pressure and formulary reshuffling |
| 2030 | 96 | 89 | 98 | Higher competitive substitution risk in payor tiers |
Translation to WAC (list price) logic
Even when net pricing erodes, WAC commonly continues small increases for branded products. The projection expectation is:
- WAC growth remains positive
- Net realized pricing declines or flattens due to rebate adjustments
This yields:
- Revenue protection if volume holds
- Margin compression if volume declines or net price resets downward at rebids
What are the commercialization signals investors and R&D leaders should monitor?
Access and contracting KPIs
Track:
- Formulary tier movement (preferred vs non-preferred)
- PA approval rates and documentation rejection rates
- Contract effective dates and rebate escalators
Competitive share indicators
Track:
- Script share changes by PBM segment
- Uptake in bipolar depression and schizophrenia relative to branded and generic competitors
- Shifts to long-acting injectables in schizophrenia care pathways
Demand by strength and indication
VRAYLAR’s pricing and volume are strength- and indication-mix sensitive. Monitor:
- Prescribing patterns by maintenance dosing
- Changes in average realized dose intensity
- Indication mix shift under payer restrictions
Key takeaways
- VRAYLAR pricing power depends less on list price than on net realized pricing, which is driven by PBM contracting and utilization management.
- Projection base-case expects net price erosion of roughly 1% to 4% over 2026-2030 under ongoing competitive and exclusivity pressure, with sharper declines in downside scenarios.
- The most material determinant of revenue trajectory is whether VRAYLAR holds access intensity across major plans; if access tightens, net price resets downward at renewal cycles.
- Investors should treat contract timing and formulary position as the leading indicators of realized price changes, ahead of macro demand changes.
FAQs
1) What pricing measure matters most for VRAYLAR?
Net realized pricing matters more than list price because specialty drug rebates and contracting determine realized revenue.
2) Will VRAYLAR’s list price keep rising?
List price (WAC) typically continues incremental upward moves for branded products, but that can coexist with net price erosion due to higher rebates.
3) What scenario drives the biggest downside to net price?
Loss of preferred access, tighter PA/step therapy, and more aggressive PBM rebate demands around exclusivity pressure typically produce the steepest net price decline.
4) Which KPIs best predict future pricing pressure?
Contract renewal outcomes (rebate rates, tier placement, PA controls) and PBM script-share changes predict realized pricing moves better than broad market share headlines.
5) How should R&D teams use these projections?
Use the scenario range as a budgeting envelope for margin planning and partner negotiations, then update quarterly with contract-cycle and access signals.
References
[1] AbbVie. VRAYLAR (cariprazine) prescribing information. https://www.rxabbvie.com/
[2] US Food and Drug Administration (FDA). Drug approvals and labeling for cariprazine (VRAYLAR). https://www.fda.gov/drugs
More… ↓
