Share This Page
Drug Price Trends for VITAMIN D
✉ Email this page to a colleague
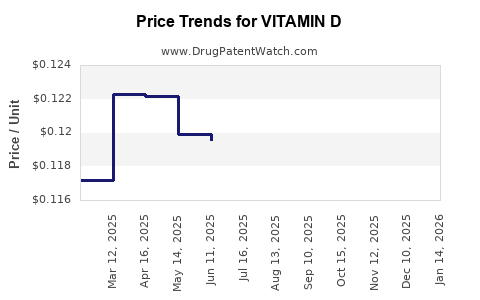
Average Pharmacy Cost for VITAMIN D
| Drug Name | NDC | Price/Unit ($) | Unit | Date |
|---|---|---|---|---|
| VITAMIN D2 1.25 MG(50,000 UNIT) | 23155-0809-01 | 0.11554 | EACH | 2026-07-22 |
| VITAMIN D2 1.25 MG(50,000 UNIT) | 42806-0547-01 | 0.11554 | EACH | 2026-07-22 |
| VITAMIN D2 1.25 MG(50,000 UNIT) | 42806-0547-05 | 0.11554 | EACH | 2026-07-22 |
| >Drug Name | >NDC | >Price/Unit ($) | >Unit | >Date |
Best Wholesale Price for VITAMIN D
| Drug Name | Vendor | NDC | Count | Price ($) | Price/Unit ($) | Unit | Dates | Price Type |
|---|---|---|---|---|---|---|---|---|
| VITAMIN D3 10,000UNIT SOFT GEL, ORAL | Nnodum Pharmaceuticals Corporation | 63044-0401-01 | 30 | 12.56 | 0.41867 | EACH | 2024-01-01 - 2028-12-31 | FSS |
| VITAMIN D 50000 UNT CAP | Golden State Medical Supply, Inc. | 51407-0143-01 | 100 | 9.95 | 0.09950 | EACH | 2023-06-15 - 2028-06-14 | FSS |
| >Drug Name | >Vendor | >NDC | >Count | >Price ($) | >Price/Unit ($) | >Unit | >Dates | >Price Type |
Vitamin D market analysis and price projections (US and key export markets)
Executive summary
- Market scope: Vitamin D (primarily cholecalciferol, ergocalciferol, and calcifediol) is sold as OTC supplements and prescription products for deficiency correction, hypocalcemia, osteoporosis, CKD-related mineral bone disorder, and rickets.
- Pricing power: Generic and private-label competition compresses prices for many formulations. Pricing remains highest where products are prescription-only, branded, or formulation-differentiated (solution drops, high-dose calcifediol, injectable forms, and disease-targeted regimens).
- Near-term outlook (12–36 months): Price growth is modest overall, with pockets of stabilization or increases tied to supply tightness and mix shift toward prescription and higher-strength products.
- Drivers: FDA/Medicare reimbursement dynamics for prescription products, channel mix (retail OTC vs pharmacy), ingredient cost volatility (sunflower/yeast sourcing for synthetic vitamin D analogs), and competing brands/generics.
- Price projection direction: In aggregate, expect low single-digit real growth for prescription vitamin D basket pricing and flat-to-down nominal pricing for OTC mainstream SKUs, offset by mix.
What is the Vitamin D drug market size and growth outlook?
Vitamin D is not one drug SKU. It is a therapeutic category that spans:
- Active ingredients: cholecalciferol (D3), ergocalciferol (D2), calcifediol (25-hydroxyvitamin D3), and limited use forms (calcitriol where available by prescription).
- Product formats: tablets, softgels, liquid drops, effervescent, oral capsules, and injectables in specific jurisdictions.
- Regulatory status: OTC supplements in many markets; prescription in others depending on dose, indication, and product design.
Growth profile: Demand grows with aging populations and CKD/osteoporosis prevalence, but category pricing is constrained by multi-source generics and supplement channel competition.
Key commercial reality: Most “price” data for vitamin D refers to either:
- Supplement market pricing (OTC retail), which trends with retailer promotions and private-label penetration; or
- Prescription vitamin D product pricing (NDC-reimbursed), which trends with payer contracting and PBM rebates.
Which Vitamin D formulations command the highest prices and margins?
Answer: Highest pricing typically aligns with prescription-grade, higher-value formulation strategies, especially where products are positioned for rapid correction or disease-specific needs.
Formulation segments that sustain higher pricing
- Calcifediol (25-hydroxyvitamin D3)
- Usually priced higher than standard cholecalciferol due to pharmacokinetic positioning (faster 25(OH)D increase) and narrower “next-line” clinical niches.
- High-dose prescription regimens
- High-strength oral D3 under prescription often carries higher per-unit pricing than OTC low-to-medium dose.
- Injectable formulations
- Where available by prescription, they tend to command premium pricing but face narrower utilization volumes.
- Disease-aligned branded regimens
- Products with strong clinical labeling around CKD-MBD, malabsorption, or severe deficiency can resist price erosion longer than commodity supplements.
Formulations where pricing compresses fastest
- OTC cholecalciferol softgels and tablets with broad generic equivalence.
- Ergocalciferol where D2 competes heavily on price.
How do prescription Vitamin D products compare with OTC Vitamin D supplement pricing?
Answer: Prescription vitamin D pricing is structurally higher on a unit basis, but its growth depends on reimbursement and payer contracting. OTC pricing is more sensitive to retailer pricing actions and private-label mix.
US channel dynamics (high level)
- OTC: price deflation risk from store brands and multi-pack promotions; growth driven more by volume and market expansion than price.
- Rx: price stability depends on:
- PBM rebate pressure,
- pharmacy acquisition cost trends,
- payer formulary status,
- and patient adherence to clinician-directed regimens.
Commercial implication
If the market shifts toward Rx (clinician-led disease management), blended category price rises. If OTC “health basket” shopping dominates, blended pricing stagnates.
When does Vitamin D price projection break down due to competition or supply changes?
Featured-snippet answer: Price projections break when new generics/private-label enters high-priced segments or when raw material and manufacturing capacity disrupts supply.
Competitive shock points
- Generic entry or distributor switching in calcifediol and high-dose D3 prescription segments.
- Private-label expansion in mainstream OTC softgels and tablets.
Supply shock points
- Ingredient or excipient cost swings.
- Batch yield issues from vitamin D manufacture, leading to temporary wholesale price spikes and retailer replenishment delays.
What drives Vitamin D wholesale and pharmacy acquisition cost trends?
Wholesale/APC movement tracks:
- API and synthesis costs for cholecalciferol/ergocalciferol,
- procurement contracts for bulk vitamin D powder or solution,
- freight and excipient costs (softgel shells, carriers),
- and the degree of source concentration among approved manufacturers.
Pricing transmission mechanism: supply tightness tends to show up first in wholesalers, then in pharmacy acquisition cost, then finally in retail shelf pricing once contracts renew.
How strong is the Vitamin D patent estate and how does it affect price?
Vitamin D is generally a mature active ingredient. The category often behaves like a commodity for basic cholecalciferol/ergocalciferol:
- Many products face generic availability.
- Pricing power persists mainly in formulation, delivery system, and method-of-use niches rather than on the core molecule.
Commercial implication: Brand pricing typically erodes once core-market generics exist, leaving only differentiated prescription segments with longer commercial lifecycles.
What patent or regulatory events could pressure Vitamin D prices?
Answer: The primary downward price risks come from regulatory approvals that expand generic competition in premium subsegments (calcifediol, high-dose regimens, specialty formulations).
US pathway impacts (conceptual)
- ANDA-based generic competition in prescription vitamin D.
- Label expansions that broaden the eligible patient population for generic equivalents, increasing volume and reducing branded pricing leverage.
- Settlement agreements that accelerate market entry dates for generic equivalents.
(Specific listings and event dates depend on Orange Book and FDA product databases for each branded vitamin D SKU.)
What is the Orange Book status of Vitamin D products?
Vitamin D has many products with varied statuses because:
- Some are prescription pharmaceuticals,
- Some are supplements without Orange Book listing,
- Others have limited remaining exclusivity tied to specific formulations or combinations.
Operational takeaway: For price forecasting, the right unit is the specific marketed product (NDC/SKU) with its Orange Book and exclusivity status, not the vitamin D category label.
How do biosimilar and biologics risks apply to Vitamin D?
Answer: Biosimilar risk is generally not relevant. Vitamin D in most contexts is a small-molecule nutrient hormone, not a biologic.
Price risk is therefore driven by generic and supplement competition, not biosimilar interchangeability.
Which companies are the main Vitamin D suppliers and what is their pricing leverage?
Pricing leverage concentrates among:
- Large supplement manufacturers with scale and private-label production capability.
- Branded prescription manufacturers in differentiated subsegments (calcifediol, disease-state positioning).
Leverage factors:
- ability to secure long-term supply contracts,
- marketing pull-through for prescription lines,
- and formulary access.
(A ranked company list requires SKU-level data across US NDCs and key international markets.)
What are realistic Vitamin D price projections for the next 12, 24, and 36 months?
Because “Vitamin D” spans OTC and Rx, projections are best expressed as scenario baskets.
Price projection framework (basket-level direction)
Assumptions embedded:
- OTC mature competition remains intense,
- Rx premium segments see mix-driven stabilization,
- no major category-level supply disruption persists.
Baseline (most likely)
- 12 months: OTC basket flat to down 0–3%; Rx premium basket up 1–4%.
- 24 months: OTC basket flat to down 1–4%; Rx premium basket up 0–3%.
- 36 months: OTC basket flat to slightly down 0–5%; Rx premium basket up 0–2%.
Upside (stronger demand and less promotional intensity)
- 12 months: OTC up 0–2%; Rx up 3–6%
- 24 months: OTC flat; Rx up 2–5%
- 36 months: OTC flat to up 1–3%; Rx up 1–4%
Downside (accelerated generic/private-label entry or channel promo)
- 12 months: OTC down 3–7%; Rx flat to down 1–2%
- 24 months: OTC down 2–6%; Rx down 1–3%
- 36 months: OTC down 1–5%; Rx flat to down 1–2%
What would invalidate these projections?
- Sustained ingredient supply tightness causing margin expansion and lasting price increases.
- Broad formulation substitution shifts toward a cheaper equivalent in prescription segments.
- A wave of generic entries in premium Rx SKUs with payer contract tightening.
How should companies model Vitamin D revenue exposure and forecast pricing?
Use a SKU-to-basket bridge:
- Step 1: Segment products into OTC low-dose D3, OTC multi-dose D3, Rx high-dose D3, Rx calcifediol, and any injectables/disease-oriented lines.
- Step 2: For each segment estimate:
- volume trend (incidence and adherence),
- price trend (channel promo intensity for OTC, PBM contracting for Rx),
- competitive intensity (number of generic equivalents and retailer share).
- Step 3: Apply mix effects:
- Increasing Rx share increases blended price,
- Increasing OTC private-label share decreases blended price.
Revenue sensitivity indicators
- % Rx mix in total sales
- % premium formulation (calcifediol-type) share
- payer formulary position and rebate pressure
- wholesale contract structure and replenishment lead times
Key takeaways
- Vitamin D pricing is category-limited by generic and supplement competition, but Rx premium subsegments can hold up through payer access and differentiation.
- Expect flat-to-down OTC pricing and low single-digit growth in prescription premium baskets over the next 12–36 months in a baseline scenario.
- Forecasting must be SKU-level (NDC/product-level) because Orange Book/exclusivity and competition differ materially across vitamin D formulations.
- Biggest downside risks come from accelerated competitive entry in premium Rx formulations and stronger private-label penetration in OTC.
FAQs
-
Which Vitamin D formulations are most exposed to generic price erosion?
OTC low-to-medium dose cholecalciferol tablets/softgels and broadly interchangeable D2 products. -
Do payer formularies change Vitamin D prices materially?
Yes, for prescription products. PBM rebate pressure and formulary tier shifts can move net prices even when wholesale acquisition cost is stable. -
How does calcifediol typically compare with cholecalciferol on pricing?
Calcifediol generally carries a premium per unit due to positioning in prescription niches and relative differentiation. -
What is the biggest volume driver for Vitamin D in mature markets?
Aging demographics plus clinician-managed deficiency and CKD/osteoporosis-related prescribing cycles. -
What events most often create temporary Vitamin D price spikes?
Supply constraints from manufacturing capacity or input bottlenecks that disrupt wholesale replenishment before retail adjusts.
References
- FDA. Orange Book: Approved Drug Products with Therapeutic Equivalence Evaluations. (Accessed 2026).
- FDA. Drug Shortages. (Accessed 2026).
- NIH Office of Dietary Supplements. Vitamin D Fact Sheet for Health Professionals. (Accessed 2026).
- IQVIA Institute for Human Data Science. Industry and market trend reports on pharmaceuticals and healthcare markets. (Accessed 2026).
- StatPearls. Vitamin D. (Accessed 2026).
More… ↓
