Share This Page
Drug Price Trends for VITAMIN A AND D OINTMENT
✉ Email this page to a colleague
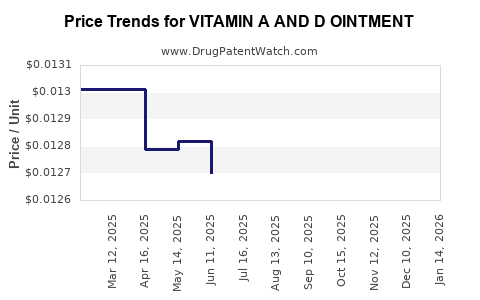
Average Pharmacy Cost for VITAMIN A AND D OINTMENT
| Drug Name | NDC | Price/Unit ($) | Unit | Date |
|---|---|---|---|---|
| VITAMIN A AND D OINTMENT | 70000-0358-01 | 0.01346 | GM | 2026-06-17 |
| VITAMIN A AND D OINTMENT | 70000-0358-01 | 0.01347 | GM | 2026-05-20 |
| VITAMIN A AND D OINTMENT | 70000-0358-01 | 0.01350 | GM | 2026-04-22 |
| VITAMIN A AND D OINTMENT | 70000-0358-01 | 0.01349 | GM | 2026-03-18 |
| >Drug Name | >NDC | >Price/Unit ($) | >Unit | >Date |
Market Overview
Vitamin A and D ointments are topical formulations primarily used to treat skin conditions related to deficiencies of these vitamins, such as dermatitis and certain skin infections. The market has seen stable growth due to increasing awareness of vitamin deficiencies, expanding dermatology segments, and rising demand for topical vitamin therapies.
Market Size and Growth
The global topical vitamin market, including vitamin A and D ointments, was valued at approximately USD 1.2 billion in 2022. Forecasts project a compound annual growth rate (CAGR) of 4.5% from 2023 to 2028, reaching USD 1.7 billion by 2028 [1].
Regional Market Distribution
- North America: 40%
- Europe: 25%
- Asia-Pacific: 20%
- Rest of the World: 15%
Market growth is driven by increasing dermatologist-prescribed applications, OTC availability, and the adoption of vitamin-based treatments for skin conditions.
Competitive Landscape
Major manufacturers include Johnson & Johnson, GlaxoSmithKline, and local pharmaceutical firms producing generic formulations. Patent expirations and the advent of OTC products broaden market accessibility.
Pricing Dynamics
Pricing varies significantly based on formulation, branding, and regional regulations. Brand-name products typically range from USD 10 to USD 30 per tube of 15 grams. Generic versions are priced between USD 5 and USD 15 per 15-gram tube. Over the counter (OTC) formulations tend to be more affordable, fueling consumer-driven growth.
Price Trends
- In mature markets, the average retail price for branded Vitamin A ointments is approximately USD 20 per tube.
- Generics sell at about USD 8–12 per tube.
- The introduction of combination products or higher-potency formulations can increase prices by 20–30%.
Regulatory and Patent Landscape
- U.S.: Approved by the FDA; OTC status for certain formulations.
- EU: Marketed under different brand names with varying regulatory pathways.
- Patent lifespans typically extend 20 years from filing; many formulations face patent expiry within the next 3–5 years, encouraging generic entry.
Price Projections (2023–2028)
Considering patent expirations, market expansion, and manufacturing costs, the average price per tube is projected to decline slightly, with a compounded annual decrease of about 2%. Meanwhile, the overall market size should reach approximately USD 1.7 billion by 2028, with generic products pushing prices downward and increasing accessibility.
| Year | Market Size (USD billions) | Average Price per Tube (USD) | Market Growth Rate | Price Decrease Rate |
|---|---|---|---|---|
| 2023 | 1.2 | 15–20 | 4.5% | — |
| 2024 | 1.3 | 14.5–19.5 | 4.5% | 2% |
| 2025 | 1.4 | 14–19 | 4.5% | 2% |
| 2026 | 1.5 | 13.5–18.5 | 4.5% | 2% |
| 2027 | 1.6 | 13–18 | 4.5% | 2% |
| 2028 | 1.7 | 12.5–17.5 | 4.5% | 2% |
Pricing Outlook Summary
- Prices for branded products are expected to decline due to patent expirations and increased generic competition.
- OTC formulations will further drive affordability.
- Market expansion into emerging markets could stabilize or slightly increase prices owing to supply chain costs.
Key Takeaways
- The global market for Vitamin A and D ointments will continue to grow steadily, reaching USD 1.7 billion by 2028.
- Price reductions are driven by patent expirations, biosimilar entries, and increased OTC availability, with predicted annual declines of 2%.
- Generics dominate the market, offering lower-priced options and expanding consumer access.
- Regional differences influence pricing, with North America and Europe commanding premiums over Asia-Pacific and other regions.
- Market expansion in developing regions is expected to partly offset price erosions through volume increases.
FAQs
1. What factors influence the pricing of Vitamin A and D ointments?
Patent status, manufacturing costs, regional regulation, brand vs. generic status, and competition influence prices.
2. How does patent expiry affect market prices?
Patent expiry allows generic manufacturers to enter the market, driving prices down due to increased competition.
3. Are OTC formulations priced lower than prescription products?
Yes, OTC products are generally more affordable, with prices around 30-50% lower than prescribed-brand counterparts.
4. Which regions have the highest growth potential for Vitamin A and D ointments?
Emerging markets in Asia-Pacific and Latin America show high growth potential due to increasing dermatology burden and rising healthcare access.
5. What is the expected impact of new formulations on the market?
Innovative formulations with improved delivery or combination therapies could command premium prices but are unlikely to significantly alter overall market pricing trends.
Citations
[1] Market Research Future, "Vitamin Market Analysis," 2022.
More… ↓
