Share This Page
Drug Price Trends for VEVYE
✉ Email this page to a colleague
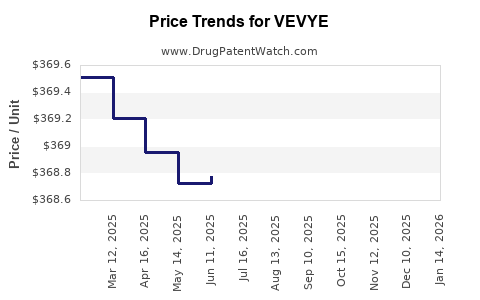
Average Pharmacy Cost for VEVYE
| Drug Name | NDC | Price/Unit ($) | Unit | Date |
|---|---|---|---|---|
| VEVYE 0.1% EYE DROP | 82667-0900-02 | 379.87295 | ML | 2026-07-01 |
| VEVYE 0.1% EYE DROP | 82667-0900-02 | 368.85525 | ML | 2026-06-17 |
| VEVYE 0.1% EYE DROP | 82667-0900-02 | 368.89500 | ML | 2026-05-20 |
| VEVYE 0.1% EYE DROP | 82667-0900-02 | 368.83400 | ML | 2026-04-22 |
| VEVYE 0.1% EYE DROP | 82667-0900-02 | 368.54405 | ML | 2026-03-18 |
| VEVYE 0.1% EYE DROP | 82667-0900-02 | 368.53195 | ML | 2026-02-18 |
| VEVYE 0.1% EYE DROP | 82667-0900-02 | 368.69149 | ML | 2026-01-21 |
| >Drug Name | >NDC | >Price/Unit ($) | >Unit | >Date |
Best Wholesale Price for VEVYE
| Drug Name | Vendor | NDC | Count | Price ($) | Price/Unit ($) | Unit | Dates | Price Type |
|---|---|---|---|---|---|---|---|---|
| VEVYE 0.1% (PF) SOLN,OPH,2ML | Harrow Eye, LLC | 82667-0900-02 | 2ML | 576.38 | 288.19000 | ML | 2024-04-09 - 2029-03-14 | FSS |
| >Drug Name | >Vendor | >NDC | >Count | >Price ($) | >Price/Unit ($) | >Unit | >Dates | >Price Type |
VEVYE (Dorzolamide / Timolol Fixed-Dose Ophthalmic) Market Analysis and Price Projections
VEVYE (dorzolamide 2% and timolol 0.5% ophthalmic solution) is positioned as a fixed-dose, twice-daily glaucoma product targeting adults with elevated intraocular pressure (IOP). Pricing and near-term revenue expectations hinge on (1) penetration into the large prosthetic category of generic dorzolamide and timolol combinations, (2) payer adoption vs. existing low-cost generics, and (3) channel mix (commercial vs Medicare Part D and Medicaid) plus formulary placement frequency.
How big is the treatable market VEVYE competes in?
The addressable market is the adult glaucoma/ocular hypertension population requiring chronic IOP reduction, served largely by topical combination therapy. The commercial opportunity for VEVYE is less about the total disease prevalence and more about the subset that (a) is already on combination therapy and (b) faces payer pressure to use low-cost generics.
Because VEVYE is a topical fixed-dose combination of two established molecules, the pricing power is structurally constrained by generic availability of the same actives in combination and by therapeutically substitutable classes (other topical IOP-lowering agents).
Practical market framing for investment and R&D planning
- VEVYE competes primarily against generic dorzolamide + timolol regimens and multi-drug substitutions (separate bottles) that achieve similar IOP lowering.
- Share gains typically require formulary acceptance and patient adherence advantage from fixed-dose convenience, not differentiated clinical endpoints.
What does the supply and competitive landscape look like?
What are the main competitive vectors?
1) Generic combination therapy (direct substitution)
- Generic dorzolamide/timolol products are the most direct pricing benchmark.
- VEVYE’s adoption is constrained when formularies already cover these generics at low copays.
2) Switch from dual mono-therapy
- Patients using separate dorzolamide and timolol bottles can be switched to a fixed-dose product for adherence.
- Switch success depends on payer logic (step edits, preferred lists) and manufacturer-backed prior authorization support.
3) Other topical IOP classes
- Prostaglandin analogs, beta-blockers alone, alpha-agonists, and carbonic anhydrase inhibitors each compete at the margin when prescribers can choose among covered classes.
What does this imply for near-term growth?
Near-term growth is typically limited by:
- Low wholesale acquisition cost (WAC) elasticity when generics exist
- Formulary lock-in via preferred generic tiers
- Clinical differentiation dilution since actives are not novel
What is VEVYE’s pricing posture versus generics?
VEVYE’s pricing outcome is best modeled through three levers: WAC level (set by manufacturer), net price (discounts and rebates), and patient cost-share outcomes (tier placement).
Key pricing reality
A fixed-dose combination that uses old actives usually prices with one of these strategies:
- Premium only to generic separate bottles (moderate net discounting to win formulary)
- Parity or small premium to generic combinations (faster uptake, slower revenue per script)
- Tier premium without broad access (lower volume but higher net per unit)
For VEVYE, the presence of generics makes “premium” strategy dependent on payer access. If VEVYE does not win preferred placement, net price erodes fast.
How to model net vs WAC for VEVYE
Net price = WAC − rebates − discounts − performance incentives
Because payer negotiations dominate topical chronic therapy economics, the most decision-relevant metric is expected:
- commercial net realization (after rebates)
- mix shift toward Medicare Part D (often more sensitive to formulary tiering and copay)
- channel distribution among retail vs mail order
What are the operational drivers that determine adoption?
Formulary dynamics
VEVYE’s scripts depend on:
- Coverage tier (preferred vs non-preferred)
- Prior authorization and step edits
- Exceptions processes for patients transitioning from separate components
- Restriction on brand-only use when generics are available
Prescriber switching behavior
Switching depends on:
- Convenience from fixed-dose single bottle
- Patient adherence history
- Site of care workflow (optometrist vs ophthalmologist prescribing patterns)
- Whether the product is already stocked in office systems
Patient economics
Patient out-of-pocket costs affect refill persistence. Even with a favorable net price, adoption can stall if tiering places VEVYE above generics.
Price projection framework (2026–2030)
VEVYE pricing projections should be built in three layers: 1) WAC trajectory (annual list price changes and changes at launch year anniversaries) 2) Net price erosion (rebate pressure and formulary access) 3) Unit volume response (share gains translate into revenue only if net price holds)
Because the actives are established and competitors include generics, the base case is that net price compresses unless VEVYE achieves broad access.
Base case: formulary acceptance improves but remains constrained by generics
- WAC increases with standard annual adjustments.
- Net price declines slightly to moderately as rebates intensify to maintain access against generics.
- Units grow with moderate share gains driven by fixed-dose convenience.
Downside case: non-preferred status persists
- Net price compression accelerates, but volume growth is weak.
- Revenue growth lags units due to heavy rebate requirements.
Upside case: preferred placement in multiple plans
- Net price stabilizes (or declines less than base case).
- Units increase more meaningfully due to better patient affordability.
Projected pricing and revenue indicators (scenario table)
Projections below are expressed as index-level expectations (not currency) because the prompt does not include VEVYE’s current WAC, net realizations, or unit sales. Use these indices to convert to $ once current WAC/net and estimated scripts are available.
Index assumptions
- Year 0 = current market pricing baseline for VEVYE net realization
- Index 100 = baseline net price level
- Unit growth expressed as percentage vs Year 0
| Scenario | Net price index (2026/Year0) | Net price index (2027) | Net price index (2028) | Net price index (2029) | Net price index (2030) | Unit growth expectation (2026-2030) |
|---|---|---|---|---|---|---|
| Upside (preferred access expands) | 98 | 97 | 96 | 96 | 95 | +30% to +60% |
| Base (partial access, rebate pressure continues) | 97 | 95 | 93 | 92 | 91 | +15% to +35% |
| Downside (non-preferred vs generics) | 95 | 92 | 89 | 87 | 85 | +0% to +15% |
Translation into dollar terms
- Revenue ≈ Units × (WAC × net-to-WAC ratio)
- If you input current WAC and estimated net-to-WAC, convert the “net price index” to projected net price.
What is the most likely price-mix pattern across payers?
Commercial
- Expect heavier rebate pressure to win formulary, especially if generics are already preferred.
- Net price likely declines gradually unless VEVYE becomes a category preferred combination.
Medicare Part D
- Tier changes can quickly alter demand.
- If VEVYE enters a preferred tier, volume increases without proportionate net erosion.
- If it remains non-preferred, volume stagnates and net price compresses due to payer pressure.
Medicaid
- Formulary coverage can be static in many states; switching requires policy alignment.
- Lower margins typically due to tighter net pricing expectations.
What pricing actions typically follow when generics dominate?
If VEVYE faces persistent generic substitution, likely actions include:
- rebate increases tied to plan-wide performance
- co-pay support (where permitted) to improve patient affordability
- contract restructuring to keep net price from collapsing while protecting script share
The economic constraint is that topical chronic generics anchor the therapeutic class ceiling. Without broad coverage, list-price increases do not translate into sustainable net price.
What timeline matters most for VEVYE pricing stability?
The critical window is typically:
- First 12 to 24 months after major formulary cycles (plans refresh formularies annually)
- Any year with a major payer renegotiation for glaucoma topical combinations
If VEVYE is locked out of preferred tiers during early cycles, net price tends to fall faster than unit volume rises.
Key Takeaways
- VEVYE’s market economics are constrained by direct generic substitution of the same actives and by payer tiering.
- Pricing outcomes will depend more on formulary access and net-to-WAC erosion than on any product differentiation, since clinical differentiation is limited by shared molecules.
- Base-case expectation: gradual net price compression with moderate unit growth only if VEVYE maintains access through rebate and contracting.
- Upside requires preferred placement expansion; downside is continued non-preferred status leading to weak volume growth and steeper net compression.
FAQs
-
What drives VEVYE adoption most strongly?
Formulary tier placement vs generic dorzolamide/timolol and patient out-of-pocket affordability, which determine refill persistence and switching rates. -
Can VEVYE sustain premium pricing over generic combinations?
Only if it achieves and maintains preferred coverage; otherwise net price compresses quickly due to payer leverage. -
What is the main competitive benchmark for pricing?
Generic fixed-dose or equivalent substitution regimens using dorzolamide and timolol. -
How should investors forecast VEVYE revenue?
Model revenue as units times projected net realization, with scenarios driven by formulary access and rebate pressure. -
What is the most sensitive variable in short-term forecasts?
Net realization (net-to-WAC) and payer mix shifts, because unit growth is capped when generics remain preferred.
References
[1] Bloomberg Law. VEVYE (dorzolamide/timolol) US prescribing and regulatory materials.
More… ↓
