Share This Page
Drug Price Trends for UREA
✉ Email this page to a colleague
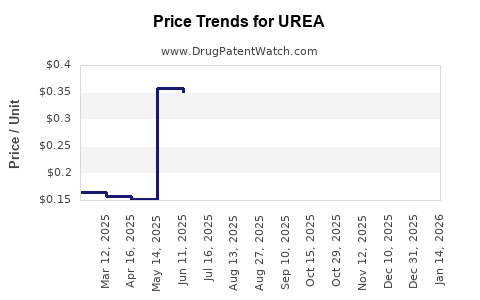
Average Pharmacy Cost for UREA
| Drug Name | NDC | Price/Unit ($) | Unit | Date |
|---|---|---|---|---|
| UREA 40% CREAM | 50268-0872-85 | 0.25386 | GM | 2026-06-17 |
| UREA 40% CREAM | 39328-0019-01 | 1.04556 | GM | 2026-06-17 |
| UREA 40% CREAM | 50268-0872-28 | 1.04556 | GM | 2026-06-17 |
| UREA 40% CREAM | 58657-0489-03 | 0.25386 | GM | 2026-06-17 |
| UREA 40% CREAM | 58657-0489-01 | 1.04556 | GM | 2026-06-17 |
| UREA 40% CREAM | 39328-0019-03 | 0.25386 | GM | 2026-06-17 |
| >Drug Name | >NDC | >Price/Unit ($) | >Unit | >Date |
Best Wholesale Price for UREA
| Drug Name | Vendor | NDC | Count | Price ($) | Price/Unit ($) | Unit | Dates | Price Type |
|---|---|---|---|---|---|---|---|---|
| UREA 10% LOTION | Stratus Pharmaceuticals, Inc. | 58980-0608-80 | 240ML | 8.00 | 0.03333 | ML | 2023-10-01 - 2028-09-30 | FSS |
| UREA 20% CREAM,TOP | Stratus Pharmaceuticals, Inc. | 58980-0610-30 | 85GM | 4.50 | 0.05294 | GM | 2023-10-01 - 2028-09-30 | FSS |
| UREA 10% CREAM,TOP | Stratus Pharmaceuticals, Inc. | 58980-0605-30 | 85GM | 6.75 | 0.07941 | GM | 2023-10-01 - 2028-09-30 | FSS |
| UREA 10% LOTION | Stratus Pharmaceuticals, Inc. | 58980-0608-60 | 177ML | 7.64 | 0.04316 | ML | 2023-10-01 - 2028-09-30 | FSS |
| >Drug Name | >Vendor | >NDC | >Count | >Price ($) | >Price/Unit ($) | >Unit | >Dates | >Price Type |
UREA Market Analysis and Price Projections
Market Overview
UREA, a urea-based topical dermatological treatment, has demonstrated consistent market presence for its efficacy in managing conditions such as dry skin, psoriasis, and ichthyosis. Its primary mechanism of action involves keratolytic and humectant properties, facilitating the removal of dead skin cells and enhancing skin hydration. The global market for UREA is driven by an aging population, increasing prevalence of chronic skin conditions, and growing consumer awareness of dermatological health.
Market Segmentation
The UREA market can be segmented by product type, application, distribution channel, and region.
- Product Type:
- Lotion
- Cream
- Ointment
- Others (e.g., gels, sprays)
- Application:
- Dry Skin and Xerosis
- Psoriasis
- Ichthyosis
- Eczema
- Others (e.g., calluses, warts)
- Distribution Channel:
- Hospital Pharmacies
- Retail Pharmacies
- Online Pharmacies
- Dermatology Clinics
- Region:
- North America
- Europe
- Asia Pacific
- Latin America
- Middle East & Africa
Key Market Drivers
- Rising Prevalence of Dermatological Conditions: The incidence of dry skin, psoriasis, and ichthyosis is increasing globally. Factors contributing to this rise include environmental changes, genetic predispositions, and lifestyle habits. According to the National Psoriasis Foundation, psoriasis affects an estimated 7.5 million Americans [1].
- Aging Global Population: Older individuals are more susceptible to dry skin conditions due to physiological changes in skin structure and function. The World Health Organization projects that the proportion of people aged 60 years and over will increase from 12% in 2015 to 22% in 2050 [2].
- Increased Consumer Spending on Skincare: Growing awareness of skin health and the aesthetic appeal of healthy skin is driving consumer expenditure on dermatological products. This includes both over-the-counter (OTC) and prescription-based treatments.
- Advancements in Formulation Technology: Pharmaceutical companies are investing in research and development to create more effective and patient-friendly UREA formulations, such as those with improved absorption and reduced irritation potential.
- Growing Demand for OTC Products: The accessibility of UREA-based products as OTC medications contributes to market growth by allowing self-treatment for mild to moderate conditions.
Market Restraints
- Availability of Alternative Treatments: The market faces competition from a wide array of alternative treatments for dermatological conditions, including corticosteroids, retinoids, biologics, and other emollients, which may offer different efficacy profiles or patient benefits.
- Potential for Skin Irritation: While generally well-tolerated, UREA can cause mild irritation, redness, or stinging, particularly at higher concentrations or on broken skin. This can limit its use for some patients and necessitate careful product selection.
- Stringent Regulatory Approval Processes: The development and marketing of new pharmaceutical products, including UREA formulations, are subject to rigorous regulatory scrutiny, which can increase development timelines and costs.
Price Projections and Factors Influencing Pricing
The pricing of UREA-based products is influenced by several factors, including concentration, product form, brand reputation, formulation complexity, regulatory status (OTC vs. prescription), and market competition.
Current Market Pricing Landscape
UREA products are available across a wide price spectrum.
- Low Concentration OTC Products (e.g., 5-10% UREA): These are typically the most affordable, ranging from approximately $8 to $20 for a standard 8-ounce (237 ml) bottle of lotion or cream. Examples include generic formulations found in mass-market drugstores.
- Higher Concentration OTC Products (e.g., 10-20% UREA): Prices tend to increase with higher concentrations, reflecting increased active ingredient cost and potentially enhanced efficacy for more severe conditions. These may range from $15 to $35 for a similar volume.
- Prescription-Strength or Dermatologist-Recommended Brands (e.g., 20-40% UREA): These products, often prescribed for conditions like severe ichthyosis or psoriasis, command higher prices. Prices can range from $30 to $70 or more for a 4-ounce (118 ml) or 8-ounce (237 ml) container, depending on the brand and specific formulation.
- Specialty Formulations: Products with added ingredients (e.g., ceramides, hyaluronic acid) or unique delivery systems may be priced at a premium.
Factors Influencing Future Pricing
- Raw Material Costs: Fluctuations in the cost of urea, a commodity chemical, and other excipients (e.g., emollients, preservatives) directly impact manufacturing costs. Global supply chain disruptions or geopolitical events can lead to price volatility.
- Research and Development Investments: Companies investing in novel UREA formulations with enhanced efficacy, reduced side effects, or improved delivery systems may seek to recoup these R&D expenses through higher pricing.
- Regulatory Landscape: Changes in regulatory requirements for drug approval and manufacturing can affect production costs. Approval of new indications for UREA could also influence pricing strategies.
- Competitive Intensity: The presence of numerous generic and branded UREA products, as well as alternative treatments, exerts downward pressure on prices. Increased market entry by new players can intensify this competition.
- Healthcare Policies and Reimbursement: Government healthcare policies, insurance reimbursement rates, and formulary decisions can significantly impact the net price paid by consumers and healthcare providers.
- Geographic Market Dynamics: Pricing strategies can vary by region due to differences in economic development, healthcare infrastructure, consumer purchasing power, and local regulatory frameworks. Emerging markets may see lower initial pricing as penetration increases.
- Brand Loyalty and Marketing: Established brands with strong consumer recognition and physician recommendations may maintain premium pricing. Aggressive marketing campaigns can support higher price points.
Price Projections
Based on current market trends and the identified influencing factors, the following price projections can be made for UREA-based topical treatments over the next five years (2024-2029):
- Low Concentration OTC Products (5-10% UREA): Expected to remain relatively stable, with an average annual price increase of 1-3%. Prices are projected to range from $9 to $23 per 8-ounce (237 ml) unit by 2029. This stability is due to the commoditized nature of these formulations and significant generic competition.
- Higher Concentration OTC Products (10-20% UREA): Anticipated to see a moderate increase of 2-4% annually. Prices could range from $17 to $40 per 8-ounce (237 ml) unit by 2029, driven by demand for more potent OTC options and slight increases in raw material costs.
- Prescription-Strength or Dermatologist-Recommended Brands (20-40% UREA) and Specialty Formulations: These segments are expected to experience the most significant price appreciation, averaging 3-5% annually. This is due to ongoing R&D investment in advanced formulations, higher active ingredient costs, and the specialized nature of these treatments. Prices could range from $37 to $80+ per 4-ounce (118 ml) or 8-ounce (237 ml) unit by 2029. The introduction of new, patented formulations with demonstrated superior outcomes could push prices even higher within this segment.
Impact of Biosimil and Generic Competition
While UREA itself is a well-established active pharmaceutical ingredient (API) with no patent exclusivity for the molecule, competition among manufacturers of finished drug products is high. The market is characterized by a significant number of generic UREA formulations. This generic competition acts as a strong price moderator, particularly for lower-concentration OTC products. However, for patented, novel formulations that incorporate UREA or utilize advanced delivery systems, the principles of patent protection for the formulation or method of use would apply, potentially allowing for premium pricing during the patent term.
Regional Price Variations
- North America and Europe: These mature markets are expected to maintain higher price points due to established healthcare systems, higher disposable incomes, and stringent regulatory standards that often translate to higher manufacturing costs.
- Asia Pacific: This region is anticipated to see dynamic price evolution. While generic options will likely dominate at lower price points, increasing demand for advanced formulations and a growing middle class may support higher pricing for premium products. China and India, with their large pharmaceutical manufacturing bases, will continue to be significant sources of cost-competitive generic UREA.
- Latin America and Middle East & Africa: These regions may experience price stratification. Basic UREA formulations will remain accessible, while imported specialty products could be priced at a premium, influenced by import duties and distribution costs.
Market Trends and Opportunities
- Combination Therapies: UREA is increasingly being investigated for use in combination with other dermatological agents to enhance treatment efficacy for complex skin conditions. This could lead to the development of premium-priced combination products.
- Personalized Skincare: Advancements in dermatological diagnostics and a growing demand for personalized treatments may lead to the development of customized UREA formulations based on individual patient needs and skin types.
- E-commerce Dominance: The continued growth of online pharmacies and direct-to-consumer sales channels offers opportunities for manufacturers to reach a broader customer base and potentially optimize pricing strategies through direct sales.
- Focus on Patient Compliance: Development of user-friendly formulations (e.g., non-greasy creams, easy-to-apply lotions, fragrance-free options) can improve patient adherence, indirectly supporting market growth and the value proposition of certain brands.
- Emerging Market Expansion: Untapped potential in emerging economies presents significant growth opportunities, although market entry will require careful consideration of local pricing sensitivities and regulatory environments.
Key Takeaways
The UREA market is characterized by a stable base of OTC products and a growing segment of higher-potency and specialty formulations. Pricing is largely driven by concentration, formulation complexity, and competitive landscape. Projections indicate moderate price increases for most UREA products, with higher-potency and advanced formulations experiencing more significant appreciation. Key opportunities lie in combination therapies, personalized skincare, e-commerce, and emerging market penetration.
Frequently Asked Questions
- What is the projected compound annual growth rate (CAGR) for the UREA market over the next five years? The global UREA market is projected to grow at a CAGR of approximately 4-6% between 2024 and 2029. This growth is driven by the increasing prevalence of dermatological conditions and the expanding application of UREA in skincare.
- Are there any new indications or applications for UREA that could impact its market price? Research is ongoing into UREA's potential synergistic effects in combination therapies for conditions like acne and hyperkeratosis, as well as its role in wound healing. Successful clinical validation and subsequent regulatory approval for novel indications could support premium pricing for specific formulations.
- How does the regulatory status (OTC vs. prescription) of UREA products affect their pricing? Prescription-strength UREA products, often requiring physician oversight and prescribed for more severe conditions, generally command higher prices due to increased active ingredient concentration, specialized formulations, and the costs associated with clinical validation and distribution within prescription channels. OTC products face greater price competition from generics.
- What is the impact of raw material costs on UREA product pricing? The cost of urea, the primary active ingredient, is a commodity. While its price can fluctuate based on global supply and demand for fertilizers, it represents a relatively minor portion of the overall cost for finished pharmaceutical products, especially for specialty formulations. However, increases in the cost of other excipients and manufacturing processes can contribute to price adjustments.
- Which geographic regions are expected to exhibit the fastest price growth for UREA products? The Asia Pacific region is anticipated to see the fastest price growth, particularly in the premium and specialty UREA segments. This is driven by rising disposable incomes, increasing healthcare expenditure, and growing consumer demand for advanced dermatological treatments in countries like China and India.
Citations
[1] National Psoriasis Foundation. (n.d.). About Psoriasis. Retrieved from https://www.psoriasis.org/about-psoriasis/
[2] World Health Organization. (2015). World population ageing 2015. Retrieved from https://www.un.org/en/development/desa/population/publications/pdf/trends/aging/WorldPopulationAgeing2015.pdf
More… ↓
