Last updated: February 14, 2026
Thiamine (Vitamin B1) is a water-soluble vitamin crucial for carbohydrate metabolism and neural function. It is available both as a dietary supplement and in pharmaceutical formulations. The global market for thiamine is driven by increasing demand from the food fortification, dietary supplement, and pharmaceutical sectors.
Market Size and Growth Trends
- The global thiamine market was valued at approximately $450 million in 2022.
- It is projected to grow at a compound annual growth rate (CAGR) of roughly 4.2% from 2023 to 2030.
- Growth is fueled by increasing awareness of nutritional deficiencies and higher demand for fortified foods, especially in Asia-Pacific and Latin America.
Demand Drivers
- Rising prevalence of nutritional deficiencies and malnutrition.
- Expanding use in food fortification programs to combat beriberi.
- Increasing adoption as a supplement for neurological health.
- Growing pharmaceutical uses, particularly in complex vitamin B supplement formulations.
Market Segments
- By Formulation:
- Injectable solutions: Used for severe deficiency cases.
- Oral tablets and capsules: Main segment in dietary supplements.
- Bulk powder and raw material: Used by manufacturers.
- By Distribution Channel:
- Pharmaceutical companies: Largest buyers, accounting for roughly 50% of the total market.
- Food producers and supplement manufacturers.
- Online retail and direct sales.
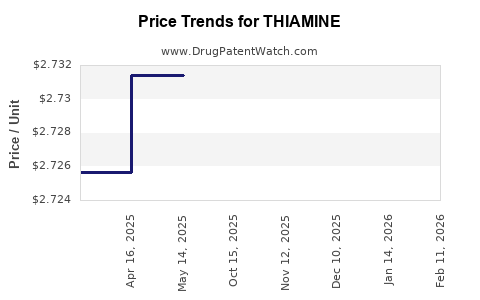
Price Dynamics and Forecast
Competitive Landscape
Major suppliers include:
- Sanofi: Offers high-quality thiamine in pharmaceutical forms.
- Zhejiang Medicine Co.: Noted for bulk raw materials in Asia.
- Farnam (Ceva): Produces veterinary-grade thiamine.
- Numerous generic manufacturers dominate the market segment for bulk and OTC products, contributing to price competition.
Regulatory Environment
- Stringent manufacturing standards exist in the US (FDA) and Europe (EMA), impacting production costs.
- Recent initiatives focus on traceability and quality assurance, possibly increasing compliance costs.
Market Opportunities and Risks
- Expansion in emerging markets presents growth opportunities.
- Emerging technologies for synthesizing thiamine could reduce production costs.
- Risks include regulatory changes, raw material shortages, and market saturation.
Key Takeaways
- The global thiamine market remains stable, with consistent growth driven by health trends.
- Prices for raw materials are relatively steady; finished product prices grow modestly.
- Demand in the pharmaceutical and fortified food sectors will sustain market expansion.
- Competition from generic manufacturers sustains prices at current levels, with inevitable pressure from cost-saving innovations.
FAQs
1. What factors will influence the price of thiamine in the next five years?
Raw material costs, regulatory standards, manufacturing costs, demand fluctuations, and technological advances in synthesis will influence prices.
2. Which region is the largest market for thiamine?
Asia-Pacific leads in demand, driven by population size and increased food fortification initiatives.
3. Are synthetic or natural sources more common for thiamine production?
Synthetic production dominates due to cost efficiency and scalability; natural sources are limited mainly to food fortification.
4. How does regulation impact thiamine market pricing?
Stringent manufacturing and quality control regulations increase compliance costs, which can be passed on to consumers and manufacturers.
5. What are the emerging opportunities in the thiamine market?
Innovations in synthesis, expanding applications in animal nutrition, and growth in developing countries are key opportunities.
Sources
- MarketsandMarkets. (2023). Thiamine market report.
- Statista. (2022). Global vitamin market data.
- Grand View Research. (2023). Nutritional supplements market analysis.