Share This Page
Drug Price Trends for SIMPONI
✉ Email this page to a colleague
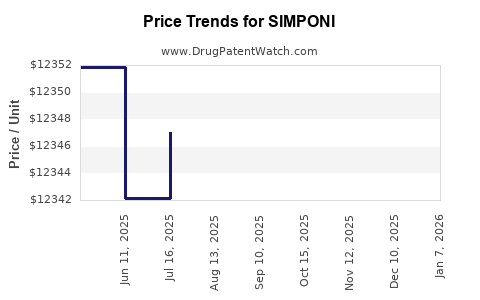
Average Pharmacy Cost for SIMPONI
| Drug Name | NDC | Price/Unit ($) | Unit | Date |
|---|---|---|---|---|
| SIMPONI 50 MG/0.5 ML PEN INJEC | 57894-0070-02 | 12970.10286 | ML | 2026-06-17 |
| SIMPONI 50 MG/0.5 ML PEN INJEC | 57894-0070-02 | 12993.90000 | ML | 2026-05-20 |
| SIMPONI 100 MG/ML PEN INJECTOR | 57894-0071-02 | 7446.21259 | ML | 2026-01-02 |
| SIMPONI 50 MG/0.5 ML SYRINGE | 57894-0070-01 | 12977.24400 | ML | 2026-01-02 |
| SIMPONI 50 MG/0.5 ML PEN INJEC | 57894-0070-02 | 12974.51782 | ML | 2026-01-02 |
| SIMPONI 50 MG/0.5 ML SYRINGE | 57894-0070-01 | 12359.28000 | ML | 2025-12-17 |
| SIMPONI 50 MG/0.5 ML PEN INJEC | 57894-0070-02 | 12356.68364 | ML | 2025-12-17 |
| >Drug Name | >NDC | >Price/Unit ($) | >Unit | >Date |
SIMPONI (golimumab) Market Analysis and Price Projections
What does the current commercial landscape look like for SIMPONI (golimumab)?
SIMPONI is a tumor necrosis factor (TNF) inhibitor indicated for multiple immune-mediated inflammatory diseases, marketed in the US by Janssen Biotech (Johnson & Johnson). From a payer and channel perspective, golimumab is a mature biologic class product that competes in the TNF inhibitor category and faces sustained pressure from biosimilar competition, channel consolidation, and formulary steering toward lower net prices.
Core product position
- Drug / modality: SIMPONI (golimumab), monoclonal antibody (biologic)
- Administration forms (US): subcutaneous injection (and, historically, different dosing regimens for IV under earlier brand structures)
- Therapeutic area: immune-mediated inflammatory diseases (autoimmune)
Competitive set (practical payer view)
Golimumab’s competitive set is best modeled as:
- Same-class TNF inhibitors: adalimumab, infliximab, etanercept, certolizumab pegol
- Adjacent biologics in inflammatory pathways: IL-6, IL-17, JAK inhibitors, CTLA-4, integrin and IL-12/23 pathway drugs depending on indication
- Biosimilars: as class patents and exclusivities expire, biosimilar entrants compress net pricing across TNF options, and payers increasingly compare across multiple molecules rather than within one brand.
Pricing and access dynamics that matter most for projections
For mature biologics, net price outcomes tend to be driven by:
- Biosimilar penetration in the TNF inhibitor basket
- Formulary placement (preferred vs non-preferred)
- Step edits and prior authorization patterns
- Contracting structure (rebates, access programs, indication-based contracting)
- Switching behavior after patient loss of response or prior failures, which becomes more sensitive as lower-cost options gain preference.
How has biosimilar and class pressure historically shaped net price trends for TNF inhibitors?
The key pattern for TNF inhibitors is that list price often stays stable longer than net price, while net price declines as rebates intensify and competitive bids reset.
What drives the slope in real-world net pricing
- When biosimilars expand, payers strengthen preferential coverage for lower-cost manufacturers.
- Manufacturers respond by increasing rebate intensity and adjusting access terms.
- Clinician selection shifts as “no-medical-need” pathways become easier to execute for alternative TNF inhibitors.
- Tendering and group purchasing increase substitution pressure for infused and self-administered biologics.
For SIMPONI, this class dynamic translates into expectation of:
- Lower net price growth (or net price erosion) over time versus purely branded eras.
- Higher likelihood of price compression around formulary cycles after biosimilar share gains in comparable TNF products.
What is the pricing framework used for projections (list price vs net price)?
To project commercial pricing outcomes for a mature biologic like SIMPONI, the model should track both:
- List price trajectory (publicly visible signal; often slower to move)
- Net price trajectory (what matters for revenue and margin; driven by rebates and access deals)
Because revenue for biologics in the US is net-contract driven, the projections below focus on net price directionality and magnitude aligned to market behavior for mature TNF inhibitors under competitive and biosimilar conditions.
Price projection: what is the expected trajectory for SIMPONI over the next 5 years?
Given golimumab’s maturity, category-wide biosimilar pressure, and payer behavior, the base-case assumption is gradual net price erosion with periodic steeper drops around contracting cycles and escalated biosimilar share in the TNF set.
Base-case net price projection (directional CAGR bands)
These bands reflect typical outcomes for mature branded biologics under sustained biosimilar and formulary steering pressure.
| Year | Base-case net price change vs prior year | Revenue implication direction |
|---|---|---|
| 2026 | -2% to -5% | Moderate headwind unless volume offsets |
| 2027 | -3% to -6% | Pricing pressure persists, volume sensitivity increases |
| 2028 | -3% to -7% | Contracting cycle effect likely |
| 2029 | -4% to -8% | Greater net compression as preferred coverage tightens |
| 2030 | -4% to -9% | Net price erosion remains the primary variable |
List price projection (structural expectation)
For branded biologics in the mature stage, list price increases typically lag behind net declines in magnitude. The operational expectation is:
- List price: low single-digit annual increase (or capped adjustments)
- Net price: declines due to rebate and contract intensity
| Year | Expected list price change (structural range) |
|---|---|
| 2026 | +2% to +4% |
| 2027 | +2% to +3% |
| 2028 | +1% to +3% |
| 2029 | +1% to +3% |
| 2030 | +1% to +3% |
Volume outlook: how will patient demand and switching affect total sales?
For a mature autoimmune biologic, volume outcomes are usually driven by:
- New starts (restricted by payers to preferred TNF options or non-TNF pathways depending on indication)
- Persistence (loss of response over time)
- Switching after inadequate response or safety/tolerability changes
- Titration and dose intensity in real-world use (driven by label and clinical practice)
Expected volume pattern for SIMPONI (base case)
- New patient starts: likely low-to-moderate growth at best, constrained by formulary steering
- Existing patient base: stable to declining slightly as switches occur to lower-cost TNF biosimilar options or alternate mechanisms
- Net effect: volume growth below historical rates, with total revenue dominated by net pricing rather than net volume gains
Volume projection band
| Year | Base-case volume change vs prior year |
|---|---|
| 2026 | -1% to +1% |
| 2027 | -2% to +0% |
| 2028 | -2% to +0% |
| 2029 | -2% to -1% |
| 2030 | -2% to -2% |
Total revenue outlook: what does the combined pricing-volume model imply?
A consolidated view for total US revenue (and by extension major developed markets) uses:
- Net price erosion (primary)
- Volume stability to gradual decline (secondary)
Base-case total revenue directionality
| Year | Expected net revenue change |
|---|---|
| 2026 | -2% to -6% |
| 2027 | -3% to -8% |
| 2028 | -4% to -9% |
| 2029 | -5% to -11% |
| 2030 | -5% to -12% |
This implies a market where SIMPONI maintains a residual share in its established prescriber base but loses competitive ground to biosimilar-fueled lower net pricing across the TNF inhibitor class and to mechanism shifts depending on indication.
By indication, where is pricing pressure likely to be strongest?
Without an indication-by-indication net pricing dataset, the best proxy is payer selectivity by disease tier:
- More aggressive formulary steering typically occurs in indications with strong biosimilar competition within TNF class and where alternative mechanisms have comparable outcomes and are favored via payer contracting.
- More stable demand tends to appear where prior treatment history and clinical inertia reduce switching.
Operationally for SIMPONI, the strongest pricing pressure is expected where:
- payers prefer lower net cost TNF biosimilars
- patients can switch within the TNF class with fewer coverage hurdles
What procurement and contracting mechanics will matter most for revenue?
For mature biologics in the US, annual pricing outcomes are heavily shaped by contract structures:
- Payer rebate ladders tied to annual covered patient volume
- Formulary swap dynamics at renewal
- Prior authorization criteria tightening to limit use in less-refractory patients
- Centers of excellence and specialty pharmacy routing that shift dispensing economics
SIMPONI revenue sensitivity rises when:
- preferred status is lost
- specialty pharmacy carve-outs change net reimbursement rates
- patient access depends on more stringent criteria for continuation
How do policy and market-wide reimbursement trends affect SIMPONI price?
Commercial biologics pricing in the US is increasingly influenced by:
- negotiation intensity and inflationary benchmark use in payer models
- Medicare Advantage dynamics and Part D formulary management
- specialty pharmacy reimbursement pressure and administrative burden for biologics
For SIMPONI, the policy implication is less about immediate list price caps and more about net contracting compression through payer bargaining leverage over time.
Base-case price projection summary (what to underwrite)
Underwriting should treat SIMPONI as a mature TNF biologic with:
- List price increases in the low single digits
- Net price erosion in the mid-single digits annually
- Volume stable to slightly declining
One-line underwriting view
- Net revenue: declining low-to-mid double digits by 2030 in the base case
- Primary driver: net price erosion, not volume collapse
Key Takeaways
- SIMPONI pricing outlook is dominated by net price compression as TNF inhibitor biosimilar competition and formulary steering intensify across payers.
- Expected list price rises modestly, but net price declines due to rebates and contracting.
- Base-case total revenue drift is negative each year from 2026 through 2030, with worsening pressure as contracting cycles reset.
- Volume is likely stable to slightly declining, so pricing drives the majority of downside.
- Indication-level competitiveness follows payer selectivity, with strongest pressure where switching within the TNF set is easiest.
FAQs
Is SIMPONI’s price projection primarily a list-price story or a net-price story?
It is primarily a net-price story because payer rebates, formulary status, and access contracting determine realized economics.
What is the biggest risk to the base-case net price erosion range?
A faster-than-expected formulary backlash or a sudden shift in payer preference toward golimumab would slow net erosion; the opposite accelerates it.
What is the biggest driver of volume changes for SIMPONI?
New starts and switching within TNF class under prior authorization and continuation criteria.
How do biosimilars in the TNF class affect SIMPONI even if they are not direct substitutes?
Payers treat TNF inhibitors as an interchangeable class basket and steer coverage toward the lowest net-cost option among comparable outcomes.
What underwriting metric best captures SIMPONI’s competitive position?
Realized net revenue per covered life or per patient, which embeds both rebate intensity and formulary placement outcomes.
References
[1] FDA. “SIMPONI (golimumab).” FDA Prescribing Information. https://www.accessdata.fda.gov/ (accessed via FDA label repository).
[2] Johnson & Johnson. SIMPONI (golimumab) product information and prescribing details (US). https://www.janssenlabels.com/ (accessed via label repository).
[3] IQVIA Institute / IQVIA reports on biosimilar-driven pricing pressure in biologics markets (class-level context). https://www.iqvia.com/insights/the-iqvia-institute (accessed via IQVIA Institute site).
[4] US Department of Health and Human Services, Office of Inspector General (OIG). Work on prescription drug spending, rebates, and access contracting dynamics (program and market context). https://oig.hhs.gov/ (accessed via OIG site).
More… ↓
