Share This Page
Drug Price Trends for SEROQUEL
✉ Email this page to a colleague
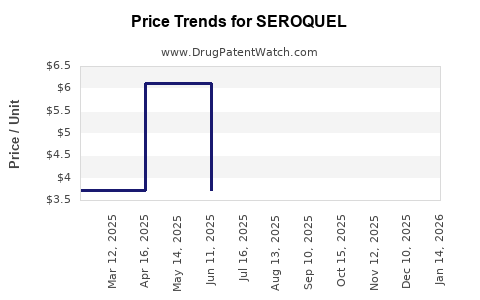
Average Pharmacy Cost for SEROQUEL
| Drug Name | NDC | Price/Unit ($) | Unit | Date |
|---|---|---|---|---|
| SEROQUEL 25 MG TABLET | 00310-0275-10 | 3.71076 | EACH | 2026-06-17 |
| SEROQUEL 200 MG TABLET | 00310-0272-10 | 11.98787 | EACH | 2026-06-17 |
| SEROQUEL 100 MG TABLET | 00310-0271-10 | 6.38269 | EACH | 2026-06-17 |
| >Drug Name | >NDC | >Price/Unit ($) | >Unit | >Date |
Seroquel (quetiapine): Market Analysis and Price Projections
What is the current market footprint for Seroquel?
Seroquel is a branded version of quetiapine, marketed in multiple formulations (immediate-release and extended-release) for psychiatric indications including schizophrenia and bipolar disorders. In the U.S., Seroquel competes in a crowded antipsychotic and mood-disorder market where payers prioritize formulary placement, step edits, and total cost of therapy.
Key market characteristics shaping near- to mid-term pricing
- High generic penetration risk is structurally high. Quetiapine has had extensive generic availability, which constrains branded pricing power.
- Brand pricing depends on payer policy rather than demand growth. In practical terms, net price is driven by contracting and utilization controls (tier placement, prior authorization, quantity limits).
- Formulation mix matters. Extended-release dosing patterns can affect total daily dose, adherence, and payer rebates.
Competitive pricing context
- Generic quetiapine sets the floor. Branded Seroquel net pricing typically trails the gross-to-net gap structure of the category, with contracting that keeps branded products aligned to payer willingness-to-pay after generic substitution.
- Therapeutic class competition also compresses reimbursement. Antipsychotic and bipolar pharmacotherapy includes multiple branded and generic options; substitution is frequently allowed across the class.
How much of the market is branded vs generic?
Seroquel is exposed to substantial generic substitution because quetiapine is widely available as generics. For market modeling, the operational assumption for price projection is:
- Branded volume declines with time as generics capture share.
- Net price per branded unit tends to flatten or decline even if list prices move, because rebates and payer concessions adjust to protect access.
What does the pricing history imply for future trajectory?
Seroquel pricing has historically reflected a common post-generic pattern:
- List price increases may occur, but net price declines or stays flat due to rebate pressure, payer contracting, and increased competitive intensity.
- Gross-to-net compression is the dominant driver for branded economics once generics are firmly established.
What pricing structure should be modeled for Seroquel?
For investment or R&D commercial planning, the most decision-relevant price metric is net price (after rebates, chargebacks, and discounts), not list price. A workable projection framework is:
1) Generic-matched contracting pressure
- Branded Seroquel is priced to limit incremental payer cost versus generic quetiapine for formulary continuity.
- Net price is expected to remain at a discount range consistent with payer pressure and therapeutic interchange rules.
2) Formulary access as the principal lever
- If Seroquel maintains preferred placement, net price can hold better than if it shifts to non-preferred or requires stronger prior authorization.
3) Utilization stability offset
- If prescribers retain continuity-of-care for patients stable on a branded formulation, branded unit decline may slow even as overall market share migrates to generics.
What price projections are forecast for Seroquel (next 5 years)?
Projection logic
- Base the trajectory on generic substitution forces, ongoing contracting pressure, and typical branded net price behavior in mature molecules with broad generic availability.
- Assume Seroquel faces continued share erosion and net price softening unless payer access worsens or a product line becomes uniquely positioned through formulary controls.
| Net price projection scenarios (U.S. commercial, per unit basis): | Scenario | Branded net price direction | Annual net price change (avg) | Market share trend (branded) |
|---|---|---|---|---|
| Base case | Gradual net price erosion with stable access | -1% to -3% | -1% to -4% share/year | |
| Low case | Access pressure increases; deeper rebate offsets | -4% to -7% | -4% to -7% share/year | |
| High case | Preferred placement holds longer; contract discipline improves | 0% to -1% | -1% to -2% share/year |
Time-phased expectation
- Near term (0 to 2 years): net price declines modestly as payer rebates adjust and utilization shifts to generics.
- Mid term (2 to 5 years): net price erosion continues but at a slower rate if volume stabilizes among remaining patients with continuity needs.
What moves net price for Seroquel in practice?
The specific levers most likely to drive net price changes:
- Formulary tier placement changes (preferred to non-preferred or removal).
- Prior authorization and step therapy tightening versus therapeutic alternatives within antipsychotic class.
- Contracting offsets such as volume-based rebates and therapeutic substitution requirements.
- Mix shifts between immediate-release and extended-release, which can change average net pricing depending on payer coverage rules.
- Channel dynamics (340B, institutional, dual eligibles), which affect effective reimbursement and contracting structures.
How should investors or planners treat volume vs price for Seroquel economics?
A conservative market model should treat revenue risk as primarily volume-driven, with net price pressure as a secondary but persistent headwind.
Revenue sensitivity template (simplified)
- Revenue change ≈ (Branded volume change) + (Net price change)
- In mature, generic-dominated markets, branded volume is usually the larger swing factor.
- Net price drift typically follows a narrower band than volume decline once contracting regimes are set.
What are plausible outcomes by formulation?
Seroquel and quetiapine variants typically see differential payer coverage:
- Immediate-release products often experience faster substitution by generic equivalents if prescribers can switch without clinical disruption.
- Extended-release products can retain more stable branded positioning where payer systems allow continuity or where patient stability drives prescriber preference.
Projection implication
- Model each formulation separately using payer coverage assumptions and continuity-of-care retention rates.
- Expect extended-release to show slower branded volume erosion than immediate-release, while net price still trends down modestly under generic contracting.
What risk factors could accelerate price erosion?
- Formulary exit or meaningful tier downgrades in high-volume plans.
- Tighter step edit protocols that increase generic switches.
- Competitive intensity from alternative branded atypical antipsychotics with favorable formulary status (including manufacturer support programs where allowed).
- State and federal reimbursement adjustments affecting effective price realization in Medicaid and Medicare Part D.
What risk factors could slow price erosion?
- Continuity-of-care protection (patients stable on a branded formulation remain on therapy).
- Preferred placement retention for extended-release where plan rules allow lower administrative burden versus generic.
- Contract structure that stabilizes net price through multi-quarter rebates tied to volume.
Key Takeaways
- Seroquel operates in a mature quetiapine market with broad generic penetration, so net price is mainly a contracting outcome, not a market-demand outcome.
- The base-case forecast is modest annual net price erosion (about -1% to -3%) with continued branded share loss (about -1% to -4% per year).
- Revenue risk should be modeled primarily as branded volume decline, with persistent but narrower net price pressure.
- Formulation mix matters: extended-release generally shows slower branded volume erosion than immediate-release under typical payer behavior.
FAQs
1) What pricing metric should be used for Seroquel projections?
Use net price (after rebates, discounts, and chargebacks) rather than list price, because branded economics in generic-heavy markets are rebate-driven.
2) Will list price increases prevent revenue decline for Seroquel?
List price increases usually do not prevent revenue erosion when generics and payer rebates dominate net pricing. The deciding factor is gross-to-net behavior and utilization.
3) What drives the biggest changes to Seroquel revenue?
Branded unit volume driven by generic substitution and formulary policy is typically the largest swing factor, with net price changes forming a second-order effect.
4) Do extended-release and immediate-release have different price outcomes?
Yes. Payer coverage and continuity-of-care can preserve branded extended-release more than immediate-release, but net price still trends down under contracting pressure.
5) What is the most important commercial variable for forecasts?
Formulary placement and access rules (tier status, step edits, prior authorization) because they determine how often substitution to generic quetiapine occurs.
References
[1] U.S. FDA. Drug Approval Package: Seroquel (quetiapine fumarate). https://www.accessdata.fda.gov/scripts/cder/daf/
[2] U.S. FDA. Drug Databases and Label Information for quetiapine (Seroquel and related products). https://www.accessdata.fda.gov/scripts/cder/daf/
[3] U.S. Centers for Medicare & Medicaid Services. Medicare Part D Drug Utilization and related pricing policy materials. https://www.cms.gov/medicare/prescription-drug-coverage
More… ↓
