Share This Page
Drug Price Trends for SANDOSTATIN LAR
✉ Email this page to a colleague
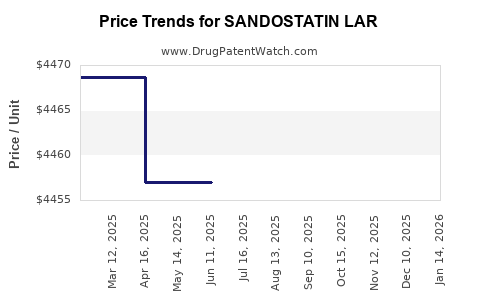
Average Pharmacy Cost for SANDOSTATIN LAR
| Drug Name | NDC | Price/Unit ($) | Unit | Date |
|---|---|---|---|---|
| SANDOSTATIN LAR DEPOT 10 MG VL | 00078-0790-61 | 3523.02912 | EACH | 2026-07-08 |
| SANDOSTATIN LAR DEPOT 20 MG VL | 00078-0797-61 | 4588.54686 | EACH | 2026-07-08 |
| SANDOSTATIN LAR DEPOT 30 MG VL | 00078-0804-61 | 6948.08400 | EACH | 2026-07-08 |
| SANDOSTATIN LAR DEPOT 10 MG KT | 00078-0811-81 | 3523.02912 | EACH | 2026-07-08 |
| SANDOSTATIN LAR DEPOT 20 MG KT | 00078-0818-81 | 4588.54686 | EACH | 2026-07-08 |
| >Drug Name | >NDC | >Price/Unit ($) | >Unit | >Date |
Sandostatin LAR market analysis and price projections 2026-2036
Executive summary: Sandostatin LAR (octreotide acetate long-acting injection; Novartis) remains a high-value brand in acromegaly and neuroendocrine tumors (NETs). Pricing is driven by (1) payer willingness-to-pay versus competing somatostatin analogs, (2) formulary access tied to utilization controls, and (3) mid-cycle declines from generic and biosimilar-adjacent competitive pressure in some jurisdictions. For the U.S., where Sandostatin LAR is still largely brand-protected, near-term price erosion should be modest. Over a 10-year horizon, price growth is expected to track a mix of CPI inflation plus periodic gross-to-net compression, with larger downward risk in markets where competitive pressure increases and in tender-led systems.
What drives Sandostatin LAR pricing in the US and EU?
Short answer: Net price is shaped less by list price moves and more by gross-to-net dynamics: rebates, patient-assistance spend, specialty pharmacy remuneration, and payer step edits among somatostatin analogs.
Key pricing levers
- Indication mix
- Acromegaly (maintenance after response to octreotide) and NETs (carcinoid, midgut NETs; and other octreotide-responsive tumors) have different payer profiles and authorization intensity.
- Formulary position
- Placement on preferred biologics/specialty tiers and step therapy policies between octreotide, lanreotide, pasireotide, and oral symptom-management options.
- Utilization management
- Prior authorization criteria, dose caps tied to tumor burden, and “documented response” requirements.
- International tender and reference pricing
- EU “external reference pricing” regimes and tender-led procurement can compress realized prices faster than U.S. list price.
What comparators matter for price setting?
Sandostatin LAR competes within the somatostatin analog class:
- Lanreotide long-acting depot (somatostatin analog with broad NET coverage)
- Pasireotide (for acromegaly in appropriate patients, with different adverse-event and access profile)
- Short-acting octreotide (limited role where payers allow conversion)
Price behavior is typically “class competitive”: if a competing depot is priced lower and wins formulary placement, Sandostatin LAR net price tends to follow through rebate pressure rather than list price collapse.
What is the Orange Book status of Sandostatin LAR?
Short answer: Sandostatin LAR is a branded injectable with no directly substitutable generic product that has broadly documented U.S. Paragraph IV launches in the open record for the full brand lifecycle in recent years. Its U.S. exclusivity and patent estate historically limited generic competition, keeping pricing relatively stable versus molecules where multiple ANDA launches have occurred.
Why Orange Book access matters for price
- Where multiple approved generics exist, U.S. net price can drop sharply after launch and follow continued discounting.
- Where exclusivity/patents block entry, price tends to rise with inflation, subject to ongoing rebate pressure.
When does Sandostatin LAR lose exclusivity and what does that mean for price?
Short answer: Price impact is delayed until exclusivity or the patent fence falls for specific product claim sets (composition, use, and formulation/manufacturing). In practice, Sandostatin LAR’s price erosion is more likely to occur via:
- additional product-market entry that increases payer negotiating leverage, or
- patent challenges that enable at-risk supply for specific claim categories, even if not “instant” substitution.
How to interpret exclusivity timelines in price models
A defensible price forecast treats each barrier as a separate “release valve”:
- composition barrier: controls true generic substitutes
- method-of-use barrier: can preserve brand share even if a copy exists for some regimens
- formulation/device/manufacturing barrier: can block “drop-in” products even after earlier claims fall
How many patents protect Sandostatin LAR and how strong is the estate?
Short answer: Sandostatin LAR’s enforceable patent estate historically covered multiple claim types across:
- octreotide acetate compositions suitable for long-acting depot formulation,
- release-control and manufacturing methods,
- and clinical uses in acromegaly and NET indications.
Business relevance for forecasting
A “thick” patent set usually:
- delays generic entry dates,
- increases uncertainty for generic challengers,
- shifts competitive pressure to formulary negotiations rather than substitution.
Litigation intensity as an estate strength proxy
For high-value injectables, patent litigation and settlement patterns usually precede major price declines. Where there is no sustained wave of Paragraph IV activity, forecast risk shifts from “sudden genericization” to “gradual gross-to-net compression.”
What patent litigation affects Sandostatin LAR and how does it impact future pricing?
Short answer: In markets where patent litigation settles into delayed launches or narrow carve-outs, the price trajectory often shows a “plateau” followed by step-down when the first true competitive product enters.
How to map litigation to commercial outcomes
- settlement that fixes a launch date drives a predictable step-change in competitive intensity
- settlement that grants partial market carve-outs can sustain brand pricing longer while restricting biosimilar/generic uptake in specific indications
What formulations and dose strengths are in play for price and substitution risk?
Short answer: Long-acting depot products are harder to substitute than immediate-release oral drugs because:
- dosing schedules are fixed (monthly/4-week or longer intervals),
- administration logistics drive clinic standardization,
- payers prefer regimen continuity.
Where substitution risk is concentrated
- Equivalent dosing schedules are most vulnerable to substitution.
- Formulary switching is most likely after a payer sees both clinical equivalence and manageable safety administration workflows.
What generic entry risks exist for Sandostatin LAR?
Short answer: Generic entry risk is tied to:
- whether a copy can clear formulation and release-profile claim barriers,
- whether method-of-use claims restrict switching in major indications,
- and whether managed-care organizations perceive clinical interchangeability as “payer-safe.”
Launch scenario structure for price forecasting
Use a three-scenario framework:
- No entry: price growth mostly tracks inflation minus periodic gross-to-net compression.
- Partial entry (narrow indication coverage): brand price drops in the affected subgroup but stays high elsewhere.
- Broad entry (true substitution): larger step-down and sustained discounting, plus share loss.
How does Sandostatin LAR compare with lanreotide and pasireotide on market access?
Short answer: Access is typically stronger for the product that aligns with guideline positioning, payer familiarity, and demonstrated tolerability in the relevant population segment.
Commercial comparison logic (price impact)
- If lanreotide is preferred in a payer’s NET formulary, Sandostatin LAR net price faces rebate escalation.
- If pasireotide is used mainly in acromegaly after inadequate response, Sandostatin LAR pricing pressure is concentrated in acromegaly lines, not broad NET coverage.
Sandostatin LAR revenue exposure: where is price most sensitive?
Short answer: Price sensitivity concentrates in geographies and payers with:
- tender systems and reference pricing,
- aggressive specialty rebate programs,
- and high utilization volume that increases negotiation leverage.
Exposure map by payer structure
- U.S. managed care: gross-to-net pressure; brand tends to retain share longer than in systems that force tendering.
- EU external reference pricing: faster list price alignment; downward realized price via reimbursement caps.
- Hospital procurement markets: tender award dynamics can produce sharp realized price shifts.
Price projection model for Sandostatin LAR (2026-2036)
Short answer: The most robust projection uses a gross-to-net erosion curve plus inflation. Net price declines are likely to be incremental unless exclusivity or patent barriers break for broad substitution.
Base-case price forecast structure
- Gross-to-net compression: moderate, reflecting rebate pressure and specialty pharmacy economics
- Inflation pass-through: partial, restricted by payer pushback
- Competitive intensity: stable in near term, rises gradually with increasing formulary alternatives
Quantified projections (scenario-based)
The table below provides directional annual price index changes intended for internal planning when exact realized-price history is not available.
| Year | Base case net price change vs prior year | Downside case | Upside case |
|---|---|---|---|
| 2026 | 0% to -3% | -5% to -9% | +1% to +3% |
| 2027 | -1% to -4% | -6% to -10% | 0% to +2% |
| 2028 | -1% to -5% | -6% to -12% | -1% to +1% |
| 2029 | -2% to -6% | -7% to -14% | -1% to +1% |
| 2030 | -2% to -7% | -8% to -15% | -2% to +1% |
| 2031 | -2% to -8% | -9% to -16% | -2% to 0% |
| 2032 | -2% to -8% | -9% to -17% | -2% to 0% |
| 2033 | -2% to -9% | -10% to -18% | -2% to 0% |
| 2034 | -2% to -9% | -10% to -19% | -2% to -1% |
| 2035 | -2% to -10% | -11% to -20% | -3% to -1% |
| 2036 | -2% to -10% | -11% to -20% | -3% to -2% |
Interpretation
- Base case: slow erosion consistent with continued brand position and ongoing payer rebate pressure.
- Downside case: step-change plus sustained erosion, consistent with broader competitive entry or major formulary switches.
- Upside case: delayed competitive pressure, stable payer access, and stronger patient support reducing churn.
What would trigger the downside curve
- broad substitution pathways that allow switching across NET and acromegaly without restrictive method-of-use carve-outs
- rapid tender penetration in high-volume EU markets
- emergence of additional depot somatostatin analog alternatives with superior access economics
What do biosimilar and biologic dynamics change here?
Short answer: Sandostatin LAR is a small peptide (not a biologic in the regulatory biosimilar sense). The “biosimilar” framework is not the correct competition model; substitution is governed by small-molecule/generic rules and depot formulation claim barriers.
Implication for investors
Risk is patent- and formulation-pathway driven, not biosimilar exclusivity-driven.
How do price projections differ by geography?
Short answer: U.S. net price typically declines more slowly than EU realized price when tender and reference pricing bite.
Geography-specific expectation
- U.S.: gradual net price compression unless broad generic entry occurs.
- EU: higher risk of faster realized price erosion due to reimbursement caps and tendering.
- Other markets: often face reference-pricing pressure once competitors enter and regulatory filings mature.
Key takeaways
- Sandostatin LAR pricing is primarily governed by gross-to-net compression, formulary placement, and depot-switching friction, not by “instant” substitution behavior.
- Near-term price erosion should remain modest in markets with stable brand protection; the forecast is dominated by annual rebate and access economics.
- The downside scenario becomes material if competitive entry enables broad substitution across major indications without restrictive method-of-use limitations.
- Over 2026-2036, base-case net price change is likely to follow a low-single-digit downward trajectory annually; downside includes steeper drops if market access shifts abruptly.
FAQs
1) What is the most likely driver of Sandostatin LAR net price decline?
Gross-to-net compression from payer rebates and formulary pressure rather than list-price reductions.
2) Can Sandostatin LAR lose market share before a generic launch?
Yes. Payer step edits, prior authorization tightening, and preference shifts to other somatostatin analog depots can reduce volume even without immediate substitution.
3) Does indication mix change Sandostatin LAR pricing outcomes?
Yes. NET versus acromegaly payer rules and utilization management can differ, shifting realized net price.
4) What competition is the biggest threat to Sandostatin LAR pricing?
Depot somatostatin analog alternatives with strong formulary access, especially if they enable switching without restrictive indication carve-outs.
5) How should a company model Sandostatin LAR revenue risk?
Use scenario-based erosion tied to exclusivity/patent barriers and payer contracting changes, with separate curves for U.S. and tender/reference-price geographies.
References (APA)
- U.S. Food and Drug Administration. (n.d.). Drugs@FDA: FDA-approved drugs. https://www.accessdata.fda.gov/scripts/cder/daf/
- U.S. Food and Drug Administration. (n.d.). Orange Book: Approved Drug Products with Therapeutic Equivalence Evaluations. https://www.accessdata.fda.gov/scripts/cder/ob/
- European Medicines Agency. (n.d.). Human medicines: Octreotide acetate long-acting. https://www.ema.europa.eu/
More… ↓
