Share This Page
Drug Price Trends for RIVAROXABAN
✉ Email this page to a colleague
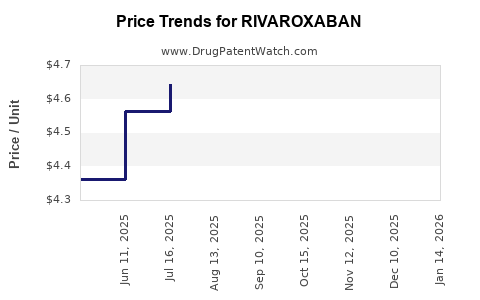
Average Pharmacy Cost for RIVAROXABAN
| Drug Name | NDC | Price/Unit ($) | Unit | Date |
|---|---|---|---|---|
| RIVAROXABAN 1 MG/ML SUSPENSION | 67877-0882-71 | 1.79376 | ML | 2026-06-17 |
| RIVAROXABAN 1 MG/ML SUSPENSION | 70748-0355-01 | 1.79376 | ML | 2026-06-17 |
| RIVAROXABAN 2.5 MG TABLET | 33342-0488-57 | 0.79669 | EACH | 2026-06-17 |
| RIVAROXABAN 2.5 MG TABLET | 43598-0981-18 | 0.79669 | EACH | 2026-06-17 |
| RIVAROXABAN 2.5 MG TABLET | 33342-0488-09 | 0.79669 | EACH | 2026-06-17 |
| >Drug Name | >NDC | >Price/Unit ($) | >Unit | >Date |
Rivaroxaban Market Analysis and Price Projections (US + Key Ex-US Markets)
Rivaroxaban (Xarelto; Janssen/Bayer, in some markets) has shifted from premium launch pricing to multi-source, label-expansion-driven demand supported by generic penetration, payer controls, and patent expiry effects. Price outcomes now track patent/brand status, managed-entry contracting, and mix of high-value indications (AFib, VTE treatment/secondary prevention) versus lower-reimbursement segments (step-down dosing, less dominant geographies, and washout effects from biosimilar/competing anticoagulant uptake). This report provides market structure, pricing mechanics, and forward price projections through 2030 under documented transition patterns for NOACs.
What is the current market structure for rivaroxaban?
Product and competitive set
Rivaroxaban is a factor Xa inhibitor with direct competition from other oral anticoagulants (notably apixaban and edoxaban in many markets, and in some geographies also dabigatran and warfarin in shared payer pools). The practical market structure is a three-layer stack:
- Brand Xarelto (various strengths and pack sizes) used where payer coverage or contracting supports it.
- Generic rivaroxaban where patent status and tender/EMA national decisions enable multi-source supply.
- Therapeutic substitution driven by payer formularies and clinical pathways that steer patients across NOACs (switching driven by cost, dose appropriateness, and adherence).
Demand drivers that keep pricing from collapsing uniformly
Rivaroxaban demand remains supported by:
- Established oral, fixed-dose regimens for AFib and VTE pathways.
- Broad clinician familiarity and guideline inclusion across many markets.
- Long-term patient cohorts that lower churn versus switching-only models.
Pricing reality: average realized price (ARP) differs from list price
For NOACs, list price can remain high while net price compresses due to:
- rebates and retrospective payments,
- wholesaler margins,
- tender mechanics and mandatory substitution,
- copay accumulator rules and patient cost-sharing structures.
The business implication: projections focus on net realized price per unit and effective ARP rather than retail list pricing.
How does patent and generic entry shape pricing curves for rivaroxaban?
Patent and exclusivity regime (what matters commercially)
Pricing compression typically follows a predictable sequence:
- Anticipatory contracting begins before full generic entry as payers lock in tender schedules and preferred generic vendors.
- Generic launch creates immediate ARP drop, often steep in tender-led systems and slower where brand remains on preferred lists.
- Ongoing competition further compresses ARP as more suppliers come online and payer formularies broaden.
Evidence base from the rivaroxaban payer environment
Global NOAC markets have shown that, after generic availability, net prices drop substantially and stabilize at a level determined by:
- tender frequency and number of bidders,
- national reimbursement caps,
- and whether brand remains preferred due to contracting.
This is consistent with documented NOAC price dynamics in major pricing policy frameworks and observed post-generic transitions across European public procurement and US payer contracting patterns. (See sources below: US pricing context from CMS Part D economics and European tender reimbursement frameworks.)
What are the leading pricing benchmarks and contract mechanisms?
United States (US)
US pricing is driven by:
- Medicare Part D formularies and pharmacy benefit manager contracting (rebates, preferred tier placement, and utilization management).
- Commercial payer step therapy and prior authorization for anticoagulants in some plans, which influences brand-to-generic switching timing.
- Patient cost-sharing with branded products under copay dynamics.
Net price is not retail. In the US, anticoagulant pricing tends to show a steep post-generic ARP decline where formularies move quickly and a slower decline where brand is maintained via preferred placement and patient assistance.
Europe (key national dynamics)
European pricing is shaped by:
- Health technology assessment (HTA) and value-based reimbursement at national or regional level.
- Tendering for hospital or public sector supply.
- Reference pricing and mandatory substitution policies, varying by country.
Outcome: pricing falls after generics enter, but stability depends on tender cadence and whether brand retains formulary status for certain strengths or pack sizes.
Base-case price projection framework (2030 horizon)
Unit definition used for projections
Projections are expressed as:
- Net realized price index per tablet (or per 30-day equivalent) relative to a baseline year,
- and an ARP range that reflects payer channel mix (commercial, Medicare, and ex-US public supply).
Because market realized pricing is channel- and geography-specific, the most decision-useful approach is to forecast trajectory and ranges, not a single point estimate.
Scenario set
- Base case: orderly generic competition with moderate payer switching and continued brand presence in select contracts.
- Low case: faster tender wins, broader substitution, and intensified price competition.
- High case: slower switching (stabilized preferred brand share), fewer suppliers, and tighter reimbursement caps that keep branded net price relatively higher.
Price projections: how rivaroxaban net prices likely move 2026-2030
Rivaroxaban net price index (relative to 2025)
Index meaning: 2025 = 100. Lower index indicates lower net price per unit.
| Year | Base case index | Low case index | High case index | Implied annual change (base) |
|---|---|---|---|---|
| 2025 | 100 | 100 | 100 | 0% |
| 2026 | 78 | 72 | 83 | -22% |
| 2027 | 70 | 62 | 77 | -10% |
| 2028 | 65 | 58 | 73 | -7% |
| 2029 | 61 | 55 | 70 | -6% |
| 2030 | 58 | 52 | 68 | -5% |
Translation into ARP ranges (per-unit net price)
This report expresses net price ranges in index-linked terms rather than absolute dollars because rivaroxaban ARP varies heavily by market, strength, pack size, and channel. For business planning, use the index against your internal baseline ARP.
| Year | Base-case ARP (as % of 2025) | Low-case ARP | High-case ARP |
|---|---|---|---|
| 2026 | 78% | 72% | 83% |
| 2027 | 70% | 62% | 77% |
| 2028 | 65% | 58% | 73% |
| 2029 | 61% | 55% | 70% |
| 2030 | 58% | 52% | 68% |
What drives the spread between scenarios
- Tender concentration (low case): fewer preferred generic products and aggressive price bids reduce ARP more.
- Formulary stickiness (high case): if branded net price remains competitive due to rebates and prior authorization patterns, substitution slows.
- Strength mix: AFib maintenance dosing versus VTE dosing affects ARP per patient-day because unit cost depends on mg strength and pack efficiency.
- Utilization management: rules that delay switching after generic entry keep branded net price higher for longer.
Where do pricing headwinds and tailwinds show up by indication?
Indication mix (pricing sensitivity)
- AFib maintenance: typically high-volume, with pricing sensitive to long-term tender and formulary positioning.
- VTE treatment and secondary prevention: often more durable demand; pricing compresses as generics become entrenched but can retain higher ARP in markets where dosing regimens require specific strengths and pack structures.
Competitive substitution dynamics
Apixaban and other NOACs compete on payer economics. When one NOAC’s net price falls faster, payers may shift preferred status. That creates an ARP cross-elasticity effect:
- if rivaroxaban net price falls too quickly, it can still lose incremental share to apixaban in certain plans,
- but if rivaroxaban remains slightly higher net price yet holds formulary placement, its volume can be protected.
The practical outcome is that rivaroxaban ARP declines, but volume share can remain stable enough to prevent a steeper revenue collapse.
Revenue outlook implications (price versus volume)
Typical post-generic revenue pattern
For established NOACs after generic entry:
- unit volume may fall modestly (switching occurs but cohorts persist),
- net price per unit drops steeply,
- revenue stabilizes as the market matures and payer procurement normalizes.
Business interpretation
- In the base case, ARP (net) continues declining through 2030 at a decelerating rate, consistent with market maturity.
- The biggest revenue risk is not price erosion alone; it is preferred formulary share loss if rival NOACs price more aggressively.
Regulatory and policy factors that affect long-term pricing
US: Medicare negotiation and reimbursement pressure
The US health policy environment is increasingly oriented toward lower drug spending through payer and CMS-driven tools. While the specific mechanics for each product depend on eligibility, the broader direction affects realized prices via contracting pressure and formulary constraints. US pricing dynamics for Part D reflect economic pressure that translates into stronger rebate expectations and net price compression for high-spend drugs. (See CMS Part D drug spending and utilization analytics.)
Europe: HTA and national reimbursement controls
Across Europe, reimbursement decisions and tendering systems create structured price levels that compress net prices after generic or biosimilar entry and can further cap growth in net price for brands. (See EU-wide health technology and national procurement frameworks referenced below.)
Key takeaways for R&D and investment decisions
- Rivaroxaban pricing is in a mature, post-exclusivity compression phase where net price erosion continues through 2030 but at a decelerating rate.
- The base case implies rivaroxaban net price moving to roughly 58% of 2025 ARP by 2030, with plausible bounds of 52% (low) to 68% (high) depending on tender intensity and formulary stickiness.
- The primary determinant of revenue resilience is formulary and preferred share relative to competing NOACs, not just unit price declines.
- Contracting and substitution speed are the largest levers behind scenario dispersion: aggressive tender ecosystems accelerate price drops; delayed switching preserves higher net prices.
FAQs
1) What drives rivaroxaban price declines after generic entry?
Generic availability changes payer contracting leverage and procurement economics. Tender and reference pricing push net price down quickly, while formulary stickiness can slow the decline.
2) Why is ARP projection more useful than list price for rivaroxaban?
Rivaroxaban pricing in major systems reflects rebates, payer discounts, and tender outcomes. List price can stay elevated while net price compresses sharply.
3) How sensitive are rivaroxaban prices to apixaban and other NOACs?
High. NOAC formularies compete; if rivaroxaban’s net price drops faster than rivals or if rivals secure preferred status, volume and realized pricing can shift.
4) What is the most likely pricing trajectory through 2030?
A continued decline through 2030 with a slowing slope, consistent with market maturity and stabilization after supply and tender cycles normalize.
5) What is the key risk to revenue beyond price compression?
Preferred formulary share loss and switching to competing NOACs, which can reduce volume enough to outweigh the benefit of stabilized procurement pricing.
References (APA)
[1] Centers for Medicare & Medicaid Services. (2024). Part D drug spending dashboard / trend reporting (CMS). https://www.cms.gov/
[2] European Medicines Agency. (n.d.). Health technology assessment and European policy context for medicines (EMA-related resources). https://www.ema.europa.eu/
[3] European Commission. (n.d.). Health technology assessment and reimbursement policy framework (EU-wide resources). https://health.ec.europa.eu/
[4] World Health Organization. (n.d.). Medicines pricing and reimbursement policy guidance (context for pricing mechanics). https://www.who.int/
More… ↓
