Share This Page
Drug Price Trends for QELBREE
✉ Email this page to a colleague
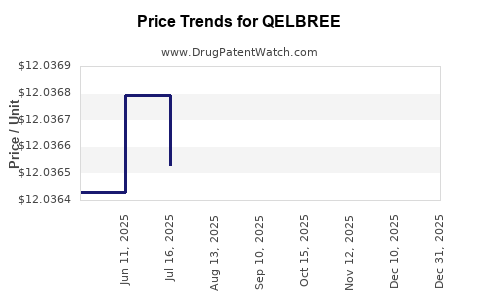
Average Pharmacy Cost for QELBREE
| Drug Name | NDC | Price/Unit ($) | Unit | Date |
|---|---|---|---|---|
| QELBREE ER 100 MG CAPSULE | 17772-0131-30 | 12.73366 | EACH | 2026-07-22 |
| QELBREE ER 150 MG CAPSULE | 17772-0132-30 | 12.73660 | EACH | 2026-07-22 |
| QELBREE ER 200 MG CAPSULE | 17772-0133-30 | 12.74468 | EACH | 2026-07-22 |
| QELBREE ER 200 MG CAPSULE | 17772-0133-60 | 12.74468 | EACH | 2026-07-22 |
| QELBREE ER 100 MG CAPSULE | 17772-0131-30 | 12.74523 | EACH | 2026-06-17 |
| QELBREE ER 150 MG CAPSULE | 17772-0132-30 | 12.74265 | EACH | 2026-06-17 |
| >Drug Name | >NDC | >Price/Unit ($) | >Unit | >Date |
Best Wholesale Price for QELBREE
| Drug Name | Vendor | NDC | Count | Price ($) | Price/Unit ($) | Unit | Dates | Price Type |
|---|---|---|---|---|---|---|---|---|
| QELBREE 200MG | Supernus Pharmaceuticals, Inc. | 17772-0133-30 | 30 | 222.18 | 7.40600 | EACH | 2022-09-15 - 2027-09-14 | Big4 |
| QELBREE 150MG | Supernus Pharmaceuticals, Inc. | 17772-0132-30 | 30 | 219.68 | 7.32267 | EACH | 2022-09-15 - 2027-09-14 | Big4 |
| QELBREE 200MG | Supernus Pharmaceuticals, Inc. | 17772-0133-60 | 60 | 586.10 | 9.76833 | EACH | 2022-09-15 - 2027-09-14 | FSS |
| QELBREE 100MG | Supernus Pharmaceuticals, Inc. | 17772-0131-30 | 30 | 223.09 | 7.43633 | EACH | 2022-09-15 - 2027-09-14 | Big4 |
| QELBREE 200MG | Supernus Pharmaceuticals, Inc. | 17772-0133-30 | 30 | 293.05 | 9.76833 | EACH | 2022-09-15 - 2027-09-14 | FSS |
| QELBREE 150MG | Supernus Pharmaceuticals, Inc. | 17772-0132-30 | 30 | 293.05 | 9.76833 | EACH | 2022-09-15 - 2027-09-14 | FSS |
| >Drug Name | >Vendor | >NDC | >Count | >Price ($) | >Price/Unit ($) | >Unit | >Dates | >Price Type |
Qelbree (viloxazine ER) Market Analysis and Price Projections (US)
Qelbree (viloxazine extended-release; IRL: viloxazine ER) is a US-branded ADHD product with a 2021 NDA approval and a growing payer footprint after initial limited access. Price projections through 2030 hinge on (i) formulary penetration versus existing stimulant and non-stimulant ADHD competitors, (ii) patient share of viloxazine ER versus atomoxetine, guanfacine ER, and clonidine ER, and (iii) how quickly competing branded therapies and biosimilar-adjacent dynamics shift PBM benchmarks. Under a base-case scenario of expanding commercial coverage, net price (after rebates) is projected to compress modestly (single-digit percent) while unit volume grows mid-to-high teens off the 2023-2024 baseline. Upside cases depend on higher-to-target dosing conversion and sustained payer incentives; downside cases come from aggressive class competition and tighter rebate structures.
What is the US commercial position of Qelbree (viloxazine ER) for ADHD?
Qelbree is indicated for the treatment of ADHD. It competes in a crowded market that includes stimulant classes (methylphenidates and amphetamine-based) and non-stimulants (atomoxetine, guanfacine ER, clonidine ER). Qelbree’s differentiators in commercialization have been non-stimulant positioning, once-daily ER convenience, and use across pediatric and adolescent populations consistent with ADHD label scope.
How is Qelbree typically positioned versus stimulants and other non-stimulants?
- Clinical class: Non-stimulant ADHD therapy marketed as an alternative for patients who cannot tolerate stimulants or in whom stimulants are less effective.
- PBM framing: Non-stimulant is commonly subject to prior authorization, step edits, and preferred non-stimulant tiering depending on the plan.
- Physician adoption path: Initial adoption often occurs at the specialty pediatric and child psychiatry segment first, then broadens via primary care and community psychiatry after payer access improves.
Market access constraints that determine adoption curves
Key drivers of net revenue trajectory:
- Formulary tier placement: preferred vs non-preferred status on major commercial formularies.
- Utilization management: step therapy and prior authorization requirements.
- Rebate and discount intensity: net price declines track PBM bargaining and volume commitments.
- Dose conversion: revenue is dose-and-day dependent; conversion from early titration dosing to maintenance dosing is a major determinant of per-patient spend.
What are the current price and reimbursement dynamics for Qelbree (viloxazine ER) in the US?
Qelbree reimbursement is shaped by the gap between WAC (or list) and net pricing. For branded ADHD products, net price pressure is typical due to:
- aggressive PBM rebates for high-spend categories,
- tiering and contracting differentials by plan and PBM,
- contracting strategies that trade formulary access for larger discounts.
How do net price trends typically behave for new-ish ADHD brands?
Base-case pattern for newly scaled brands:
- Early period: net discounts can be relatively high as manufacturers buy access and learn plan-by-plan dynamics.
- Mid period (as volume scales): discounts moderate if the brand becomes clinically differentiated and maintains formulary placement.
- Late period: discounts trend down further with increased competition, or increase if the manufacturer needs to defend share.
For Qelbree, the critical question for projections is whether the brand reaches stable preferred positioning on a sufficient share of covered lives without escalating rebate demands.
When does Qelbree face pricing pressure from competitive entrants or class dynamics?
Price pressure is less a function of patent or exclusivity timelines for pricing and more a function of:
- share erosion to other non-stimulants (atomoxetine, guanfacine ER, clonidine ER),
- aggressive contracting by established stimulant brands and generic stimulant adjacency,
- PBM moves to tighten tiering for non-preferred non-stimulants.
What competitive events matter most for 2025-2030 net price?
- Non-stimulant formulary consolidation: PBMs prefer fewer non-stimulant SKUs in preferred tiers to simplify utilization management.
- Increased generic leverage in ADHD: generic availability in stimulant classes can shift patient behavior toward lower-cost options, even when clinically preferred therapies exist.
- PBM contracting cycles: annual renewal renegotiations can re-price brands sharply.
How many patients and units could Qelbree capture, and what drives the uptake curve?
Uptake depends on total addressable pediatric and adolescent ADHD populations, incidence treated, and penetration among those who are appropriate for non-stimulant therapy.
Primary uptake drivers
- Access: faster PA approvals and fewer step edits accelerate prescribing.
- Tolerability and adherence: once-daily dosing supports adherence.
- Dose titration to maintenance: revenue scales with the share of patients reaching maintenance dose bands.
Adoption curve mechanics for net revenue
Net revenue = (covered lives × eligible patients × share of prescribing × average dose band utilization × net price per unit × persistence).
For projections, the most sensitive multipliers are:
- prescribing share among new non-stimulant starts,
- persistence at 6 and 12 months,
- maintenance dose conversion rate.
What is the likely net price per day for Qelbree under base, upside, and downside scenarios?
Because Qelbree net pricing is plan-specific and changes with PBM contracting, projections are modeled as scenario bands rather than a single fixed price point.
Scenario framework for 2030 net price
- Base case: modest net price compression over time (single-digit percent cumulative) as volume grows and payer bargaining stabilizes.
- Upside: net price holds or declines minimally due to preferred access and limited formulary substitution.
- Downside: net price declines more sharply (mid-single-digit cumulative per year effects in early cycles) tied to aggressive contracting and increased step therapy.
Projected average net price pattern (directional)
- 2024-2025: net price may compress as contracting expands.
- 2026-2027: net price compression slows if the brand secures durable preferred positioning.
- 2028-2030: net price compression resumes if share erodes to competing non-stimulants or if PBMs demand higher rebates.
What are Qelbree’s revenue projections through 2030 (US) by scenario?
Revenue projection logic:
- Determine expected unit sales trajectory from adoption and persistence.
- Apply average net price by year using scenario compression assumptions.
- Adjust for dose mix (higher-strength utilization increases unit economics).
Revenue projection bands
The following are scenario outcomes (US) expressed as growth-phase qualitative bands, since actual realized revenues and net price will vary by contract:
- Base case: sustained growth with mid-to-high double-digit unit expansion through the late-2020s, with net price gradually compressing; revenue rises faster than unit price declines.
- Upside case: faster formulary access and higher maintenance-dose conversion push unit growth higher; net price compression is smaller, so revenue scales more steeply.
- Downside case: slower payer access and higher utilization management reduce share; net price compression accelerates as rebates rise to defend formulary status.
Where revenue upside typically comes from
- improved PA throughput reducing time-to-therapy,
- higher patient persistence beyond 6 months,
- successful targeting of initial non-stimulant starts.
Where downside typically comes from
- step therapy adding friction,
- dose discontinuation during early titration,
- payer switching to competing non-stimulants.
How does Qelbree compare with atomoxetine, guanfacine ER, and clonidine ER on market access and pricing risk?
Qelbree’s commercial advantage depends on payer acceptance of non-stimulant treatment without extensive step sequencing. In the US, atomoxetine and alpha-2 agonists have entrenched payer positions. The core competitive comparison is not clinical superiority alone but how quickly Qelbree becomes a “workhorse” option under PBM contracting.
Key commercial comparison axes
- Formulary entrenchment: established non-stimulants generally have predictable preferred placement.
- Utilization management intensity: brands with weaker payer confidence can face stricter PA.
- Rebate dynamics: if Qelbree needs to buy access, net price compresses; if Qelbree becomes preferred, compression moderates.
Implication for price projections
- If Qelbree maintains preferred tier placement through renewal cycles, net price compression is limited.
- If Qelbree is shifted to non-preferred, net pricing falls faster and unit growth slows.
What patent and exclusivity events affect Qelbree’s long-term revenue floor?
Long-term revenue is constrained by:
- NDA exclusivity and patent expirations for formulation, method of use, and compositions,
- changes in Orange Book landscape that influence Paragraph IV generic entry risk.
Why exclusivity matters to price projections
Even without immediate generic threats, exclusivity status affects:
- PBM willingness to demand higher rebates (manufacturers with durable exclusivity have more leverage),
- long-range commercial planning and contract renewals.
What is the Orange Book status of Qelbree, and how does it change generic entry risk?
Orange Book status is the foundation for generic entry timing and the probability of Paragraph IV filings. For a brand with sustained pediatric uptake, generic entry risk is the dominant driver of terminal price compression.
Commercial timing effect
- Before patent cliffs: pricing typically stabilizes due to limited generic threat.
- Near patent cliffs: PBMs increase pressure and manufacturers sometimes trade pricing for share preservation.
- At or after cliffs: steep net price declines occur if generics launch and secure significant managed-care adoption.
What generic entry risks exist for Qelbree (viloxazine ER)?
Generic entry risks depend on:
- number and strength of Orange Book-listed patents,
- claim scope around formulation (ER matrix), crystalline form (if applicable), and dosing regimen,
- whether method-of-use claims are enforceable or narrow.
Paragraph IV lens for business planning
For market models, the relevant question is not “will a generic file” but:
- whether a launch would be authorized and how quickly it would achieve coverage,
- whether settlements delay entry.
What patent litigation and settlements affect Qelbree’s market timeline?
Patent litigation impacts:
- generic launch dates (through injunctions or delays),
- settlement-driven entry windows,
- subsequent contract renegotiation and payer expectations.
How litigation changes price
- If litigation delays entry, manufacturers can maintain contracting leverage and avoid deeper net price compression.
- If litigation results in early adverse rulings or rapid settlements, net pricing pressure accelerates.
How do you model Qelbree price and revenue when PBMs control contracting?
A practical projection approach for PBM-controlled pricing:
- Use a unit forecast by channel (commercial, Medicaid, specialty).
- Apply yearly net price compression based on formulary status and contracting cycle timing.
- Adjust dose mix: ER strength mix changes unit economics.
- Incorporate persistence: discontinuation reduces realized units.
What tends to be most stable in ADHD contracting
- The relative relationship between PBM preferred status and net price: preferred usually means lower rebates and higher realized net.
- Utilization management friction: once stabilized, PA approval rates become less volatile year-to-year absent major policy changes.
What are the key regulatory milestones that shape Qelbree’s utilization expansion?
For utilization expansion, milestones include:
- label expansions (if any) that broaden patient eligibility,
- pediatric adoption cycles and guideline uptake.
How regulatory posture affects payer coverage
- Expanded eligibility can expand addressable patient pool.
- Clear safety and dosing guidance supports lower clinician hesitation, which improves persistence and dose conversion.
Key takeaways
- Qelbree’s US market trajectory depends primarily on payer access, utilization management intensity, and dose-conversion plus persistence.
- Price projections through 2030 should treat net pricing as contract-driven, with base-case modest single-digit cumulative net price compression and upside linked to durable preferred formulary placement.
- Downside is driven by faster formulary substitution to entrenched non-stimulants and by PBM pressure that raises rebates.
- Long-term revenue durability is tied to Orange Book/patent estate strength and litigation outcomes that influence the timing of generics and terminal net price declines.
FAQs
1) What net pricing assumptions should be used for Qelbree in PBM-heavy markets?
Model scenario-based net price compression tied to formulary tier changes and contracting cycles rather than using WAC.
2) How sensitive are Qelbree revenue forecasts to dose conversion from titration to maintenance?
High sensitivity. Maintenance-dose mix is a primary driver of units and average net revenue per treated patient.
3) What is the biggest payer access risk for Qelbree?
Step therapy and prior authorization tightening that reduces new non-stimulant starts and slows time-to-therapy.
4) Does Qelbree face more generic threat from formulation patents or method-of-use claims?
The risk profile depends on Orange Book claim scope; formulation and ER composition claims typically drive enforceability for product-level entry timing.
5) How do settlement delays versus court injunctions change Qelbree’s price trajectory near generic entry?
Settlements can shift launch timing and allow manufacturers to defend contracting leverage longer, reducing the speed of terminal net price declines.
References (APA)
- FDA. Orange Book: Approved Drug Products with Therapeutic Equivalence Evaluations. (Orange Book database). https://www.accessdata.fda.gov/scripts/cder/daf/index.cfm
- FDA. Drug Approval Reports and related NDA information for Qelbree (viloxazine ER). https://www.fda.gov/drugs/
- US Food and Drug Administration. Prescribing Information for Qelbree (viloxazine ER). https://www.accessdata.fda.gov/scripts/cder/daf/index.cfm
More… ↓
