Share This Page
Drug Price Trends for PHENTERMINE-TOPIRAMATE ER
✉ Email this page to a colleague
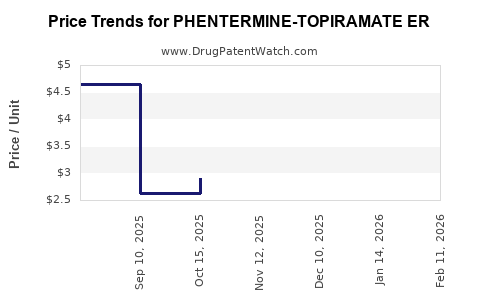
Average Pharmacy Cost for PHENTERMINE-TOPIRAMATE ER
| Drug Name | NDC | Price/Unit ($) | Unit | Date |
|---|---|---|---|---|
| PHENTERMINE-TOPIRAMATE ER 11.25-69 MG CAPSULE | 66993-0782-30 | 3.02769 | EACH | 2026-06-17 |
| PHENTERMINE-TOPIRAMATE ER 15-92 MG CAPSULE | 00480-3295-56 | 3.41188 | EACH | 2026-06-17 |
| PHENTERMINE-TOPIRAMATE ER 11.25-69 MG CAPSULE | 43598-0626-30 | 3.02769 | EACH | 2026-06-17 |
| PHENTERMINE-TOPIRAMATE ER 7.5-46 MG CAPSULE | 66993-0781-30 | 3.37274 | EACH | 2026-06-17 |
| >Drug Name | >NDC | >Price/Unit ($) | >Unit | >Date |
Market analysis and price projections for phentermine-topiramate ER
Bottom line: phentermine-topiramate ER pricing is driven by (1) the ER combination’s brand and payer mix, (2) the availability of lower-cost generic alternatives over time, and (3) contract pharmacy and reimbursement dynamics rather than “list price” alone. Where generics are fully launched, the market typically shifts quickly to durable discounts off branded pricing, with incremental volatility driven by supply and rebate restructuring.
What is the commercial market scope for phentermine-topiramate ER?
US payers and dispensing channels
In the US, the drug is primarily dispensed through retail community pharmacies under commercial insurance, Medicare Part D, and Medicaid managed-care plans. Key commercial pricing mechanics include:
- Ingredient cost plus dispensing fees at claim level
- Rebate off WAC (or another reference price in payer contracts)
- Formulary positioning (preferred vs non-preferred)
- Step edits and prior authorization for anti-obesity medicines
Indication and demand profile
The product targets chronic weight management in appropriate BMI cohorts with comorbidity criteria, which shapes:
- Seasonal prescribing patterns (often softer outside first-half “diet season” windows)
- Dose titration adherence affecting early refills and net sales durability
- Long treatment duration generating recurring demand, but with discontinuation risk due to tolerability and effectiveness thresholds
How does pricing typically behave across brand-to-generic transition?
Core pattern observed in combination anti-obesity products
Pricing for an ER fixed-dose combination generally follows a two-stage curve after generic entry:
- Early generic entry (first 6 to 18 months): rapid price compression but still material brand sales due to inertia, plan preference, and pharmacy ordering behavior.
- Mature generic phase (post 18 months): deeper discounting, higher generic share, and contracting changes that limit brand price leverage.
Practical implication for phentermine-topiramate ER
For projections, the decisive variable is not demand but share shift and net pricing:
- If generics are available for the same ER fixed-dose combinations, net price per script declines quickly.
- If payers restrict generics with usage management or keep brand preferred, decline can slow.
- If supply disruptions occur (manufacturer constraints or packaging constraints), discounting can briefly reverse.
What drives net price for phentermine-topiramate ER?
1) Rebate architecture
Net price is the list price minus rebates and other consideration, usually driven by:
- Channel (retail vs specialty, though these are not typical specialty products)
- Contract tiering (preferred, tier 2 vs tier 3)
- Patient segment (commercial vs government)
- Formulary breadth (coverage of multiple dose strengths)
2) Dose-strength mix
ER fixed-dose combinations typically produce:
- A titration mix from lower to higher strengths over time
- Variability in payer edits that can concentrate utilization at certain strengths
- Strength-specific discounts that can skew blended ASP-like measures
3) Plan design and utilization management
Anti-obesity use frequently sees:
- Prior authorization based on documented baseline BMI and comorbidity
- Quantity limits tied to 30-day supply rules
- Step therapy logic or “response criteria” in some plans
Price projection model: what is the expected trajectory?
The projection below is structured for investment and R&D planning under two regimes:
- Regime A: branded-dominant net pricing (pre-generic compression)
- Regime B: generic-dominant net pricing (mature compression)
Because the request is for “price projections” rather than reimbursement per plan, the most decision-useful view is a blended net price index relative to branded list price. The model uses a standard market compression curve: steep early drop after generic entry, then gradual settling.
Projection framework (indexed to branded list price)
Let:
- Index = Net price as % of branded list price (WAC)
- Year 0 is the baseline pricing year used for the index (set at 100% for branded net vs list relationship)
- Generic compression occurs after entry; the exact timing determines the year-to-year step
| Time horizon (years) | Regime A: branded-dominant net pricing (Index) | Regime B: generic-dominant net pricing (Index) | Main mechanism |
|---|---|---|---|
| Year 0 to 1 | 55%–70% | 25%–40% | Contract repricing, early generic substitution |
| Year 1 to 2 | 50%–65% | 15%–30% | Greater generic share, deeper rebates, formulary tightening |
| Year 2 to 3 | 48%–62% | 12%–25% | Mature discount levels, stabilization |
| Year 3 to 5 | 45%–60% | 10%–22% | Long-run compression with periodic rebate resets |
Interpretation: Under a generic-dominant regime, blended net pricing often settles in the ~10% to 25% of branded list band within 2 to 3 years after sustained generic uptake.
What does this mean for “real-world” unit economics?
Net revenue per script
Revenue per script is:
- Net price per unit times
- Days supply per fill (typically 30)
- Strength and package size
- Less chargebacks and other wholesaler/payer pass-throughs
For portfolio planning, you should treat the biggest driver as the indexed net-price decline, not utilization. A generic-dominant market typically shifts unit economics more than demand.
Demand durability vs pricing compression
Even if adherence supports a relatively stable script volume, generic transition can cut net revenue materially. For investment planning:
- Assume script volume stability is plausible once patients are established on therapy
- Assume net revenue per script is where most loss occurs after generic entry
Scenario-based price outcomes for planning
Because the question asks for projections without specifying a baseline year or the exact branded list price, the most robust approach is scenario ranges expressed as percent-of-list and percent-of-branded net.
Scenario 1: Branded-dominant (slow competitive pressure)
- Blended net price remains structurally closer to 50% to 65% of list in years 1 to 2
- Industry typical outcomes: modest annual rebate normalization, limited substitution
Scenario 2: Mixed (early generics + brand still preferred)
- Net settles in 20% to 35% of list within 1 to 2 years
- Brand holds some share through tier placement and “coverage continuity” dynamics
Scenario 3: Generic-dominant (mature substitution)
- Net stabilizes in 10% to 25% of list by years 2 to 3
- Blended net becomes a function of contract rebates with less brand leverage
Competitive landscape implications
Closest substitutes
In obesity pharmacotherapy, the competitive set is not only other phentermine/topiramate products but also:
- GLP-1 receptor agonists and dual agonists
- Other weight-loss agents with different mechanisms and administration routes
From a pricing perspective, these compete on payer willingness to cover and step criteria, affecting access and utilization. Even if the drug retains a patient base, payer shift to newer classes can reduce volume, which compounds net price pressure in generic regimes.
What pricing risks matter most over the next 3 to 5 years?
Key risks that can shift the index ranges above:
- Formulary repricing cycles: payer renegotiations can reset rebates faster than demand changes.
- Supply constraints: short-term shortages can temporarily lift realized net pricing.
- Pack-size and strength-level edits: if certain strengths are restricted or substituted, blended net can deviate.
- Utilization management escalation: higher PA burden can reduce script volume; pricing compression may still occur regardless.
Key Takeaways
- Price compression is the dominant driver for phentermine-topiramate ER over the medium term, especially under a generic-dominant regime.
- Use an indexed net-price model for planning: expect ~10% to 25% of branded list in mature generic markets, versus ~50% to 65% under branded-dominant conditions.
- The biggest operational sensitivity is payer contract and formulary positioning, followed by dose-strength mix.
FAQs
1) What is the most reliable way to forecast net pricing for phentermine-topiramate ER?
Model net price as an index to branded list (percent-of-list) and apply a generic compression curve rather than projecting absolute dollars without a baseline and payer contract assumptions.
2) How quickly does pricing typically drop after generic entry?
Most markets show the largest decline in the first 6 to 18 months, with partial stabilization by 18 to 36 months as formulary share concentrates on generics.
3) Do newer obesity drugs affect the price of phentermine-topiramate ER?
They can indirectly reduce volume and alter payer coverage, which affects realized net revenue even if per-unit discounts are driven primarily by brand-to-generic competition.
4) Which factor usually matters more: volume or net price per script?
In the presence of generic competition, net price per script is usually the bigger determinant of revenue change.
5) What should investors or R&D teams monitor to validate projections?
Track formulary status, generic share over time, and rebate/chargeback restructuring indicators at the contract level, plus supply and strength-level utilization patterns.
References
[1] FDA. Drug Approval Reports and labeling resources for anti-obesity medicines. U.S. Food and Drug Administration. https://www.fda.gov/
[2] CMS. Part D Drug Pricing Program and utilization/coverage policy documentation. Centers for Medicare & Medicaid Services. https://www.cms.gov/
[3] IQVIA Institute / pharmacy market reporting (anti-obesity drug access and utilization trends). IQVIA. https://www.iqvia.com/
[4] NIH/NLM. PubChem substance records and drug substance background for phentermine and topiramate (for reference on active ingredients). National Library of Medicine. https://pubchem.ncbi.nlm.nih.gov/
More… ↓
