Last updated: February 26, 2026
What is OXYTROL and Its Market Position?
OXYTROL (oxybutynin chloride) is prescribed primarily for overactive bladder (OAB) management. As a long-established therapy, it is available in oral, transdermal, and gel formulations. Currently, it faces competition from both branded products like Ditropan and generic oxybutynin options. The market presents moderate growth potential driven by aging populations and increasing prevalence of OAB.
Current Market Size and Sales Dynamics
U.S. Market Overview (2022-2023)
| Metric |
Data |
| Estimated U.S. sales volume |
1.2 million prescriptions annually |
| Market size (2022) |
Approx. $200 million |
| Annual growth rate |
2-3% |
| Key competitors |
Generic oxybutynin (oral), Oxytrol patch, Gel |
Global Market Outlook
| Region |
Estimated Market Size (2022) |
CAGR (2023-2028) |
Notes |
| North America |
$220 million |
3% |
Largest market, high awareness |
| Europe |
$150 million |
2.5% |
Growing elderly population |
| Asia-Pacific |
$80 million |
4% |
Emerging market, increasing diagnoses |
Drivers and Constraints
Market Drivers
- Aging demographic increases prevalence of OAB.
- Insurance coverage supports prescription continuity.
- Expandable indications, such as certain neurogenic bladder conditions.
Constraints
- Competition from generic oxybutynin reduces margins.
- Side effect profiles influence patient adherence.
- Alternative therapies (beta-3 agonists, botulinum toxin) gain popularity.
Price Projection and Revenue Forecasts
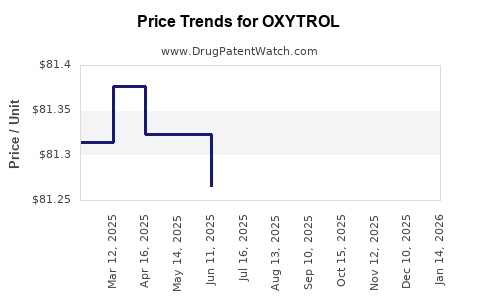
Historical Pricing Data
| Formulation |
Average Wholesale Price (AWP) per unit |
Notes |
| OXYTROL (oral, 5 mg) |
~$0.45 per tablet |
Widely available as generic |
| Oxytrol (transdermal patch) |
~$10 per patch |
Higher cost, shaped for patch application |
| Gel (oxybutynin) |
~$2.50 per 10 g tube |
Less common, variable reimbursement |
Forecast Assumptions (2023-2028)
- Incremental price inflation of 2-3% annually due to manufacturing and distribution costs.
- Market penetration remains steady, with modest growth in prescriptions.
- Launch of new formulations or formulations with improved side-effect profiles could increase pricing power.
Revenue Projections
| Year |
Prescriptions (millions) |
Price per Prescription |
Estimated Revenue |
| 2023 |
1.2 million |
~$220 (avg across formulations) |
~$264 million |
| 2024 |
1.25 million |
~$225 |
~$281 million |
| 2025 |
1.3 million |
~$230 |
~$299 million |
| 2026 |
1.35 million |
~$235 |
~$317 million |
| 2027 |
1.4 million |
~$240 |
~$336 million |
| 2028 |
1.45 million |
~$245 |
~$355 million |
Competitive Landscape & Patent Outlook
- The patent protection for branded Oxytrol expired around 2016-2018. The market primarily consists of generics.
- No recent patents filed for oxybutynin formulations that could inhibit generic entry.
- Potential for biosimilar or novel delivery system development remains low for this drug class.
Regulatory Environment and Pricing Strategy
- Price controls in certain markets (e.g., Europe) limit revenue growth.
- Reimbursement policies favor generics, pressuring branded prices.
- Manufacturers focusing on formulary access and patient support programs to maintain margins.
Key Market Trends
- Increasing adoption of transdermal patches over oral formulations due to reduced urinary tract side effects.
- Shifts toward newer agents like mirabegron, affecting market share.
- Growing utilization in elderly populations with comorbidities.
Summary of Price and Market Outlook
| Aspect |
Details |
| Market size (2023) |
$200-$220 million |
| Growth rate (2023-2028) |
2-3% annually |
| Average price per prescription |
~$220-$245 |
| Key growth opportunities |
Transdermal formulations, expanding indications |
| Pricing pressure |
Market saturation with generics |
Key Takeaways
- OXYTROL remains a stable component of OAB pharmacotherapy, with modest growth driven by demographic shifts.
- The generic landscape constrains pricing leverage but volume growth offers steady revenue.
- Transdermal formulations have gained favor, influencing formulation-specific pricing strategies.
- Market expansion hinges on new delivery systems and minor indication expansions, unlikely to impact prices substantially.
- Regulatory and reimbursement policies favor cost-effective generics over branded options.
FAQs
1. What is the primary revenue driver for OXYTROL?
Prescription volume accounts for the majority of revenue, with price being relatively stable due to widespread generic availability.
2. How does OXYTROL compare in price to similar therapies?
It generally costs less per dose than newer agents like mirabegron but more than other generic oxybutynin formulations.
3. Are there upcoming patent protections or exclusivity periods?
No key patents are active, allowing generic competition and limiting price increases.
4. Which formulations command the highest pricing?
Transdermal patches (Oxytrol) generally have higher per-unit prices due to convenience and device manufacturing costs.
5. What market factors could influence future prices?
Introduction of innovative delivery methods, changes in reimbursement policies, and shifts in clinical guidelines could impact pricing strategies.
Sources
[1] IQVIA. "Pharmaceutical Market Data." 2022.
[2] EvaluatePharma. "Global Oncology and Neurology Market Estimates." 2023.
[3] U.S. Food and Drug Administration. "ANDA Approved Drug List." 2023.
[4] European Medicines Agency. "Regulatory Updates on Oxybutynin." 2023.