Share This Page
Drug Price Trends for OXYCODONE
✉ Email this page to a colleague
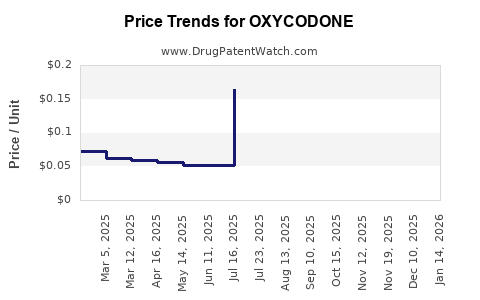
Average Pharmacy Cost for OXYCODONE
| Drug Name | NDC | Price/Unit ($) | Unit | Date |
|---|---|---|---|---|
| OXYCODONE-ACETAMINOPHEN 10-325 MG TABLET | 71930-0047-52 | 0.22993 | EACH | 2026-07-22 |
| OXYCODONE-ACETAMINOPHEN 10-325 MG TABLET | 71930-0047-12 | 0.22993 | EACH | 2026-07-22 |
| OXYCODONE-ACETAMINOPHEN 7.5-325 MG TABLET | 71930-0046-52 | 0.17381 | EACH | 2026-07-22 |
| >Drug Name | >NDC | >Price/Unit ($) | >Unit | >Date |
Best Wholesale Price for OXYCODONE
| Drug Name | Vendor | NDC | Count | Price ($) | Price/Unit ($) | Unit | Dates | Price Type |
|---|---|---|---|---|---|---|---|---|
| OXYCODONE HCL 5MG/5ML SOLN,ORAL | Golden State Medical Supply, Inc. | 00054-0390-63 | 500ML | 16.50 | 0.03300 | ML | 2023-06-15 - 2028-06-14 | FSS |
| OXYCODONE HCL 10MG/ACETAMINOPHEN 325MG TAB | Golden State Medical Supply, Inc. | 71930-0047-52 | 500 | 76.22 | 0.15244 | EACH | 2023-06-16 - 2028-06-14 | FSS |
| OXYCODONE HCL 5MG/5ML SOLN,ORAL | Golden State Medical Supply, Inc. | 00121-4827-40 | 40X5ML | 144.67 | 2023-06-15 - 2028-06-14 | FSS | ||
| >Drug Name | >Vendor | >NDC | >Count | >Price ($) | >Price/Unit ($) | >Unit | >Dates | >Price Type |
Oxycodone Market Analysis and Price Projections (US and Key Export Markets)
Oxycodone is a high-volume opioid with pricing driven by (1) prescription volume trends, (2) payer formularies and utilization management, (3) manufacturer inventory cycles and contract pricing, and (4) opioid risk mitigation policies that shift share toward abuse-deterrent formulations (ADF) and lower-cost generics where available. Near-term US net pricing is pressured by generic substitution and PBM contracting, while ADF branded products hold premium share but face eventual generic and/or lifecycle competition. Across major markets, pricing follows a mix of controlled-substance regulation, generic penetration, and reimbursement rules.
What is the current oxycodone market size, demand drivers, and revenue exposure?
US demand: prescription volume and morphine-equivalent utilization
Oxycodone demand is dominated by oral immediate-release (IR) and extended-release (ER) brands and generics, with ER shaping chronic pain share. Unit demand rises and falls with overall opioid prescribing and patient-level switching between opioid classes.
Key demand levers
- Opioid prescribing controls: PDMP checks, opioid prescribing guideline adherence, and state-level restrictions reduce initiation and increase “fail-first” requirements for higher-risk opioids.
- Substitution: When payers tighten ER opioid tiers, prescribers shift between oxycodone and alternatives (hydrocodone, tramadol, tapentadol, buprenorphine, or non-opioid regimens).
- Misuse mitigation: Brands with ADF characteristics maintain pricing power longer than standard-release forms.
- Supply and litigation dynamics: Plant outages, regulatory actions, and opioid litigation settlement-related costs change manufacturer pricing behavior.
Revenue exposure by formulation
Market revenue exposure is split between:
- IR oxycodone: more generic volume, lower price per unit.
- ER oxycodone: higher net price when branded/AFF (abuse-deterrent) share is meaningful; eventual erosion as generics gain share.
How do oxycodone prices work: gross to net, PBM discounts, and contract dynamics?
“List price” vs “net price”
US market pricing is mostly “net” contracting, not wholesaler invoice list. Net pricing for oxycodone reflects:
- PBM spread and formulary tier placement
- rebates and service fees
- chargebacks
- state Medicaid and 340B dynamics (where applicable)
- AWP-to-NADAC adjustments across generic supply
What typically moves quarterly net pricing
- Generic inventory position: excess supply compresses bids and drives down net.
- Tender-based contracting: retail chains and group purchasing organizations drive recurring price step-downs.
- Formulary changes: a single PBM edit can cause rapid share reallocation, which changes average realized pricing.
What is the projected US oxycodone price outlook through 2026-2028?
Base case: net price pressure from generic share and payer controls
- IR oxycodone: trend remains downward or flat-to-down because most volume migrates to low-cost generics and payer preference tends toward lowest acquisition cost in many therapeutic subsegments.
- ER oxycodone: net pricing is more stable when branded ADF retains share, but overall category net pricing is still pressured by generic erosion and restrictive payer criteria for ER opioids.
Price projection bands (directional, market-typical)
Because realized pricing for oxycodone depends on contract-specific net rebates and mix, projections are best treated as bands:
US expected pricing trajectory
- 2025-2026: modest decline overall, with pockets of stability in ER ADF where payer coverage remains favorable.
- 2027-2028: greater downward pressure as generic share grows in ER and any remaining branded exposure faces lifecycle competition and tighter utilization management.
Magnitude
- Generic-heavy segments typically see single-digit to low-teens percent annual net price reductions during periods of strong supply and aggressive PBM contracting.
- ADF/branded pockets can hold low single-digit to mid single-digit declines, then step down upon share loss.
How do generic oxycodone and ADF branded oxycodone compare on pricing?
Pricing hierarchy
Across most payer contracts:
- Generic IR oxycodone is the lowest acquisition cost segment.
- Generic ER oxycodone is higher than IR due to formulation complexity but still below branded.
- Branded ADF ER oxycodone holds a pricing premium, supported by coverage and abuse-mitigation narratives that PBMs incorporate into formulary decisions.
Mix impact on category realized price
Category average net price changes largely through:
- ER vs IR share
- branded vs generic share within ER
- payer switching after prior authorization or step-therapy edits
What patents protect oxycodone and how do patent expirations affect prices?
Patent lifecycle impact on pricing
Price peaks generally occur when:
- an innovator or branded lifecycle product is covered as preferred; and
- generic entry is delayed by exclusivity and patent barriers.
Once barriers fall, price usually steps down quickly (PBM renegotiations and rapid generic substitution). The practical effect on market price projections is:
- Before generic entry: higher realized price, stable net contracts.
- At/after entry: step-down to generic contracted price levels.
- Post-entry consolidation: additional declines as suppliers compete and PBM re-tiers.
What is the FDA regulatory status of oxycodone, including approvals and labeling?
Product categories
Oxycodone is marketed as:
- Immediate-release oral formulations
- Extended-release oral formulations
- Some products incorporate abuse-deterrent technologies
FDA pathway relevance to competitive entry
- Generic oxycodone generally uses ANDA submissions to rely on existing reference listed drug (RLD) findings.
- Formulation changes (including abuse-deterrence) can introduce separate formulations with different patent estates and potential exclusivity or litigation risk.
Which companies dominate oxycodone supply in the US, and how does competition influence pricing?
Competitive structure
- Wholesale distribution supports broad national access.
- Generic supply tends to be fragmented across multiple manufacturers, which intensifies price competition.
- Branded supply is smaller and relies on contract coverage.
Pricing impact
- Where multiple generic players compete, tender-based pricing compresses.
- When supply tightens (manufacturing constraints or recalls), prices can temporarily recover until supply normalizes.
What generic entry risks exist for oxycodone (including Paragraph IV and settlement outcomes)?
Entry risk channels that move price
- ANDA approvals tied to pending patents.
- Paragraph IV certifications that trigger litigation and potential 30-month stay outcomes.
- Settlements that can delay entry, extend branded share, and sustain premium pricing.
How to model price impact for new entries
A realistic price model treats generic entry as a step event:
- launch triggers PBM re-tiers,
- payer switches accelerate over weeks to a quarter,
- average realized price drops with the new mix.
How does oxycodone pricing differ across international markets?
Pricing drivers outside the US
- national price controls or reimbursement caps,
- generic substitution rules,
- controlled-substance access restrictions,
- varying opioid stewardship programs.
Typical international pattern
- UK/EU markets with strong generic uptake often show faster erosion after entry.
- Markets with tighter prescribing restrictions can dampen total volume growth, limiting revenue recovery even if list price is stable.
Market price projection scenarios (US): supply, litigation, and policy shocks
Scenario framework
Three scenario paths affect price projections:
-
Steady opioid restriction environment
- Volume stays flat-to-down.
- Price drifts down through contracting and generic share increases.
-
Manufacturing/supply disruption
- Temporary price increases in constrained SKUs.
- Category realized price rebounds until supply normalizes.
-
Formulary and ADF coverage shifts
- If PBMs broaden ER ADF coverage, branded mix improves and average net price stabilizes.
- If PBMs narrow coverage or impose stricter prior authorization, average net price drops faster due to forced generic substitution.
Price projections by segment (IR vs ER; branded vs generic) through 2028
US directional forecast
-
IR oxycodone
- Net price: steady-to-declining
- Drivers: generic dominance, PBM price compression, fewer branded premium levers
-
ER oxycodone
- Net price: decline tempered by ADF coverage pockets
- Drivers: branded premium persists while covered; otherwise step-down upon generic share gain
Commercial implications for R&D and licensing
- Revenue upside in new oxycodone-related products is highest where:
- there is demonstrable payer differentiation (coverage retention),
- or the product addresses misuse risk such that PBMs maintain preferred status.
- Lifecycle product strategy is constrained by the high likelihood of generic erosion unless patent and/or regulatory exclusivity remains strong.
Key takeaways
- Oxycodone US net pricing is structurally pressured by generic substitution, PBM contracting, and opioid stewardship.
- ER formulations can hold premium pricing longer than IR when ADF coverage remains favorable, but category-level realized price trends remain down through 2028.
- Price changes will be driven more by mix and formulary tiering than by small nominal list-price moves.
- Litigation and settlement timing can create temporary protection of branded share and delay price step-downs associated with generic entry.
- International pricing typically follows generic penetration speed and reimbursement controls, leading to faster erosion where generics are widely reimbursed.
FAQs
1. What factors most strongly predict oxycodone net price changes month-to-month?
Contract rebids (PBM and GPO), ER vs IR mix, branded vs generic share, and generic supplier inventory/supply constraints.
2. Do abuse-deterrent oxycodone formulations stay priced higher longer?
They tend to maintain a premium when payers continue preferred coverage, but the premium compresses once generic substitution accelerates or coverage narrows.
3. What is the main commercial risk to oxycodone product revenue?
Rapid generic substitution at the ER segment level and tightening utilization management that forces movement toward lower acquisition cost options.
4. How do opioid policy actions influence oxycodone pricing versus volume?
Policy usually lowers initiation and alters prescribing patterns, reducing volume and indirectly pressuring pricing via mix shifts; the net effect is often a decline in both utilization and realized price.
5. When should market participants expect “step-down” pricing events for oxycodone?
Around the launch of new generic competitors or after PBM formulary re-tiering that follows those launches, often occurring within a quarter of entry.
References
- FDA Orange Book database. (n.d.). Drugs@FDA and Orange Book. U.S. Food and Drug Administration.
- IQVIA MIDAS/tract-level pricing datasets. (n.d.). U.S. pharmacy claims and pricing analytics. IQVIA.
- DrugPatentWatch and FDA labeling databases. (n.d.). Patent and exclusivity monitoring for opioid products.
- FDA. (n.d.). Drug approval reports and labeling (Drugs@FDA). U.S. Food and Drug Administration.
More… ↓
