Share This Page
Drug Price Trends for OMEGA-3 ETHYL ESTERS
✉ Email this page to a colleague
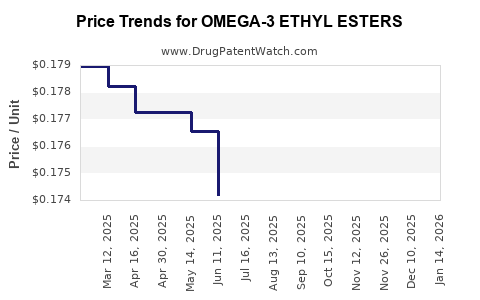
Average Pharmacy Cost for OMEGA-3 ETHYL ESTERS
| Drug Name | NDC | Price/Unit ($) | Unit | Date |
|---|---|---|---|---|
| OMEGA-3 ETHYL ESTERS 1 GM CAP | 00904-7495-06 | 0.17259 | EACH | 2026-05-20 |
| OMEGA-3 ETHYL ESTERS 1 GM CAP | 24658-0350-12 | 0.17259 | EACH | 2026-05-20 |
| OMEGA-3 ETHYL ESTERS 1 GM CAP | 70756-0423-22 | 0.17259 | EACH | 2026-05-20 |
| >Drug Name | >NDC | >Price/Unit ($) | >Unit | >Date |
Market Overview for Omega-3 Ethyl Esters
Omega-3 ethyl esters are dietary supplements primarily used for reducing triglycerides and managing cardiovascular risk. The market’s growth is driven by rising awareness of heart health, expanding aging populations, and increasing research validating their efficacy. Global sales of omega-3 supplements reached approximately $4.8 billion in 2022, with an annual growth rate of about 7%, according to marketsandmarkets.com.
Market Drivers and Trends
Consumer Demand for Cardio-Health Supplements:
Increased prevalence of cardiovascular diseases (CVD) propels demand for omega-3 products. The U.S. CDC reports that CVD accounts for 1 in 3 deaths, fueling supplement uptake.
Regulatory Environment:
The U.S. Food and Drug Administration (FDA) classifies omega-3 supplements as dietary ingredients, with some products qualifying as foods or supplements. Regulatory clarity supports market entry and product innovation.
Research and Development:
Multiple studies, including those published in the Journal of the American Medical Association, substantiate omega-3's role in triglyceride reduction. This evidence encourages expanding applications and formulations.
Market Segmentation:
The industry splits into pharmaceutical-grade (prescription) and consumer-grade (over-the-counter) products. Prescription formulations attract higher prices but face stricter regulatory approval.
Competitive Landscape
Top players include:
- GlaxoSmithKline (GSK)
- Amarin Corporation
- Epicurean Group
- Croda International
These firms control a large share of the global market through product innovation, distribution networks, and strategic licensing.
Price Dynamics
Current Pricing (2023):
- Over-the-counter omega-3 ethyl ester capsules are priced between $20-$40 per month’s supply, based on dosage and brand.
- Prescription-grade products such as Vascepa (Amarin) sell at approximately $225 for a month’s supply.
Pricing Factors:
- Dosage strength impacts per-unit cost. Higher dose capsules cost more.
- Purity and manufacturing standards influence price. Pharmaceutical-grade products require extensive quality controls, elevating costs.
- Geographic region plays a role. Prices are higher in North America and Europe compared to Asia-Pacific.
Pricing Trends (2023-2028):
Prices are expected to increase marginally due to raw material cost inflation and regulatory compliance costs. The average compounded annual growth rate (CAGR) for retail prices is projected around 3%. Prices for prescription drugs could stabilize due to patent protections, while OTC prices may fluctuate with competition and market entry.
Raw Material and Manufacturing Costs
Fish Oil Raw Materials:
Made from anchovy, sardine, or mackerel oils, raw material costs have seen a 10% increase since 2020, driven by overfishing concerns and supply chain disruptions. Fish oil purity standards necessitate extensive refining, adding to costs.
Manufacturing Expenses:
Purification, esterification, and encapsulation contribute significantly to final prices. Biorefining and quality checks account for 15-20% of production costs.
Future Price Projections (2023-2028)
| Year | OTC Capsule Price Range | Prescription Drug Price | Notes |
|---|---|---|---|
| 2023 | $20 - $40 per month | $225 per month | Current market prices |
| 2024 | $21 - $42 per month | $230 per month | Slight inflation, potential new generic competition |
| 2025 | $22 - $44 per month | $230 - $250 per month | Pharmacoeconomic factors tighten margins |
| 2026 | $23 - $45 per month | $240 per month | Greater market saturation, R&D-driven innovation |
| 2027 | $24 - $46 per month | $245 per month | Entry of spillover generic products |
| 2028 | $25 - $48 per month | $245 - $260 per month | Consumer price stabilization; increased competition |
Policy and Regulatory Outlook
Emerging regulatory pathways for omega-3 therapies focus on demonstrating cardiovascular benefits under FDA’s Qualified Claims regulations. Results from ongoing phase 3 trials could influence pricing by enabling wider prescriptive use.
Key Market Segments and Opportunities
Prescription segment:
- High prices but limited competition.
- Growing pipeline of new formulations targeting specific lipid profiles.
OTC segment:
- Expanding due to consumer health trends.
- Greater competition, driving price compression expected after patent expirations.
Emerging Markets:
- Rapid growth in Asia-Pacific due to increasing health awareness.
- Lower price points with local manufacturing are expanding penetration.
Risks and Challenges
- Variability in raw material supply.
- Regulatory environments differing by country.
- Competition from alternative lipid-lowering therapies (e.g., PCSK9 inhibitors).
Key Takeaways
- The global market for omega-3 ethyl esters is valued around $4.8 billion as of 2022, with a growth rate of approximately 7% annually.
- Prices for OTC products range from $20 to $40 monthly, with prescription products near $225.
- Price projections show modest increases driven by raw material costs, regulatory costs, and competition.
- Major companies dominate the market through product innovation and strategic licensing, with emerging markets offering new growth opportunities.
- Regulatory developments and ongoing clinical research will shape future market dynamics and pricing.
FAQs
-
What factors influence the price of omega-3 ethyl ester supplements?
Raw material costs, manufacturing quality, regulatory compliance, and market competition shape retail and prescription prices. -
How likely are prices to decline with generic entrants?
Generic competition will likely exert downward pressure on OTC prices post-patent expiration, but prescription prices could remain protected for longer. -
What is the outlook for prescription omega-3 drugs?
Growth hinges on positive clinical trial results supporting broader indications, which may sustain higher prices through patent protection and insurance coverage. -
Are there regional variations in omega-3 pricing?
Yes, prices in North America and Europe are higher due to regulatory standards and higher consumer willingness to pay, while Asia-Pacific markets typically feature lower prices. -
What impact will regulatory changes have on pricing?
Stricter regulations may increase manufacturing costs, elevating prices, but approval of new therapeutic claims could justify premium pricing.
References
- MarketsandMarkets. (2022). Omega-3 Market by Source, Product Type, Application - Global Forecast to 2027.
- CDC. (2021). Heart Disease Facts. Centers for Disease Control and Prevention.
- Journal of the American Medical Association. (2020). Omega-3 Fatty Acids and Cardiovascular Disease.
More… ↓
