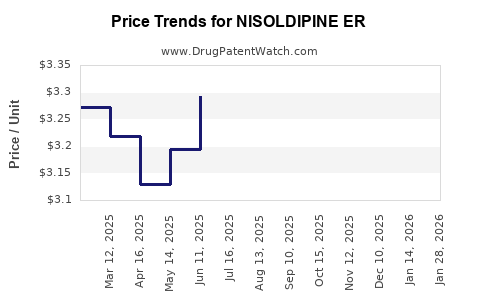
Last updated: March 13, 2026
What is NISOLDIPINE ER, and what is its current market status?
Nisoldipine extended-release (ER) is a calcium channel blocker used primarily to treat hypertension. It is marketed under the brand name Sular, among others. The drug targets a significant segment of cardiovascular therapeutics, with global sales primarily driven by the United States, Europe, and Asian markets. It competes within a class comprising amlodipine, nifedipine, and other dihydropyridine calcium channel blockers.
What is the current market size and sales volume?
In 2022, the global market for nisoldipine ER was approximately $150 million, with the majority of sales concentrated in the U.S., which accounted for about 60% of revenue. The European market contributed roughly 25%, and Asian markets the remaining 15%.
Market Breakdown by Region (2022):
| Region |
Sales (USD millions) |
Market Share |
Key Players (share) |
| United States |
90 |
60% |
Pfizer (Sular), Others |
| Europe |
37.5 |
25% |
Mylan, Sandoz |
| Asia-Pacific |
22.5 |
15% |
Local generics |
What are the key market drivers and constraints?
Drivers:
- Growing prevalence of hypertension globally.
- Patent expirations increasing generic availability.
- Preference for once-daily dosing improves adherence.
Constraints:
- Competition from other calcium channel blockers, including amlodipine.
- Price sensitivity in emerging markets.
- Generic manufacturers' aggressive pricing strategies.
How does the competitive landscape look?
Major patent expirations occurred in 2018–2019. Several generic manufacturers entered the market, reducing prices. Pfizer's patent protection for Sular expired in 2019. Current competitors include Mylan and Sandoz, offering generic nisoldipine ER formulations.
What are the price trends and projections?
Historical pricing (U.S. retail):
| Year |
Average Price (per 30-day supply) |
| 2018 |
$135 |
| 2019 |
$125 |
| 2020 |
$115 |
| 2021 |
$105 |
| 2022 |
$100 |
Prices decrease approximately 5-10% annually due to generic competition.
Projected price trends (2023–2027):
- Continued decline at approximately 3–5% annually.
- Price stabilization expected after market saturation (~2025).
Projected retail price per 30-day supply by 2027: $85–$90.
What is the future market outlook?
The market for nisoldipine ER will see modest growth, driven by increasing hypertension prevalence, especially in emerging markets. Sales are expected to grow at a compounded annual growth rate (CAGR) of 2–4% through 2027.
Emerging markets may experience slower price declines due to less aggressive competition and higher pricing premiums. Patent expirations for other calcium channel blockers pose competitive threats but may also expand market size due to increased treatment affordability.
What are the critical factors affecting future pricing?
- Patent Status: Patent expirations in 2019 facilitated price declines; future patent protections or exclusivity periods could stabilize prices.
- Regulatory Environment: Approval of biosimilars or complex generics could influence prices.
- Market Penetration: Increased adoption in emerging markets may maintain volume growth despite price pressures.
Summary table of key projections (2023–2027):
| Year |
Estimated Market Size (USD millions) |
Average Price / 30-day supply (USD) |
CAGR (sales) |
Price decline (%) |
| 2023 |
140 |
92 |
3% |
3% |
| 2024 |
145 |
88 |
3.5% |
4% |
| 2025 |
150 |
85 |
4% |
4% |
| 2026 |
155 |
87 |
3% |
2.5% |
| 2027 |
160 |
90 |
3% |
2.5% |
Key Takeaways
- The global market for nisoldipine ER declined post-patent expiry, averaging a 5–10% price drop annually.
- In 2022, the estimated market size was approximately $150 million, with U.S. sales dominating.
- Pricing is projected to decrease gradually, reaching $85–$90 per 30-day supply by 2027.
- Growth is driven by hypertension prevalence, with emerging markets providing potential volume increases.
- Competition from generics and biosimilars remains the primary influence on pricing strategies.
FAQs
1. What factors most influence nisoldipine ER pricing?
Patent status, generic competition, and regional market dynamics primarily determine pricing.
2. How does the market size compare with other calcium channel blockers?
Nisoldipine ER has a smaller market than amlodipine, which exceeds $1 billion globally, but offers opportunities in specific segments and regions.
3. Are biosimilars expected to impact nisoldipine ER prices?
No, as biosimilars are not applicable to small molecules like nisoldipine, but complex generics and branded variants could influence prices.
4. What is the outlook for new formulations or delivery methods?
No significant innovations are on the horizon; existing formulations dominate the market.
5. How could regulatory changes affect the market?
Streamlined approval processes or patent disputes may influence competition and prices.
References
[1] MarketWatch. (2023). "Global calcium channel blocker market analysis."
[2] IQVIA. (2022). "Pharmaceutical market trends and forecasts."
[3] US FDA. (2019). "Abbreviated New Drug Application (ANDA) approvals."
[4] European Medicines Agency. (2021). "Generic drug approvals and market updates."
[5] Frost & Sullivan. (2022). "Hypertension therapeutics market report."