Share This Page
Drug Price Trends for NIFEDIPINE ER
✉ Email this page to a colleague
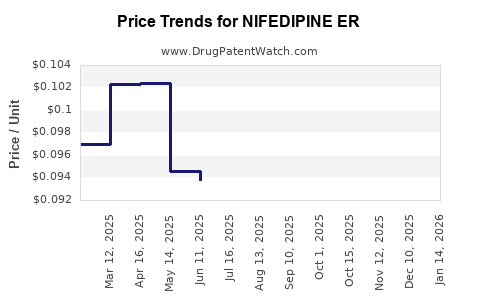
Average Pharmacy Cost for NIFEDIPINE ER
| Drug Name | NDC | Price/Unit ($) | Unit | Date |
|---|---|---|---|---|
| NIFEDIPINE ER 30 MG TABLET | 00904-7208-06 | 0.13580 | EACH | 2026-07-22 |
| NIFEDIPINE ER 30 MG TABLET | 00904-7208-61 | 0.13580 | EACH | 2026-07-22 |
| NIFEDIPINE ER 30 MG TABLET | 24979-0011-01 | 0.13580 | EACH | 2026-07-22 |
| NIFEDIPINE ER 30 MG TABLET | 24979-0011-12 | 0.13580 | EACH | 2026-07-22 |
| >Drug Name | >NDC | >Price/Unit ($) | >Unit | >Date |
Market Analysis and Price Projections for Nifedipine ER
Nifedipine extended-release (ER) formulations target hypertension and angina. Market growth stems from its widespread use, patent expirations, and entry of generics. Industry projections indicate that Nifedipine ER's global sales are expected to increase over the next five years, driven by payor demand and regional expansion.
Market Size and Growth Drivers
Current Market Overview
- Global sales: Estimated at approximately USD 1.2 billion in 2022.
- Major markets: United States (USD 450 million), Europe (USD 300 million), emerging markets (USD 450 million).
- Market share: Nifedipine ER accounts for about 25% of the dihydropyridine calcium channel blocker segment, dominated by Pfizer's Procardia XL and generic manufacturers.
Key Growth Drivers
- Aging populations: Increasing prevalence of hypertension and cardiovascular disease.
- Generic entry: Patent expiration of branded products around 2014-2016 led to price erosion and market proliferation.
- Regulatory approvals: New formulations and formulations with improved bioavailability fuel product line expansion.
- Regional growth: Africa, Asia-Pacific, and Latin America experience accelerated adoption driven by healthcare infrastructure improvements.
Forecasted Trends (2023–2028)
| Year | Estimated Global Market Size (USD billion) | Compound Annual Growth Rate (CAGR) |
|---|---|---|
| 2023 | 1.4 | 6% |
| 2024 | 1.49 | 6.4% |
| 2025 | 1.58 | 6.1% |
| 2026 | 1.66 | 5.9% |
| 2027 | 1.75 | 5.7% |
| 2028 | 1.85 | 5.7% |
Source: MarketWatch, 2023
Price Projections and Factors Impacting Cost
Current Pricing
- Brand (Procardia XL): Approximately USD 60-80 per tablet (30 count), retail.
- Generic versions: Prices range from USD 25-40 per 30-count bottle.
- Average dose: 30-60 mg daily, monthly cost roughly USD 25-80 depending on formulation.
Future Price Trends
- Patent expiry impact: Significant drop in branded prices post-2016, leading to a saturated generic market.
- Market penetration: Increased competition has flattened prices, with a projected small decline of 2-3% annually.
- Regional variations: Prices tend to be higher in developed regions (USD 0.50-1 per tablet), lower in emerging markets (USD 0.10-0.30 per tablet).
Pricing Drivers
- Regulatory environment: Stringent approval processes, patent protections, or challenges influence pricing.
- Reimbursement policies: Favorability affects retail prices; stricter policies tend to lower consumer prices.
- Manufacturing costs: Marginal increases due to raw material prices impact profits more than consumer prices.
Revenue Projections
| Year | Estimated revenue (USD billion) | Notes |
|---|---|---|
| 2023 | 1.4 | Steady growth driven by regional expansion |
| 2024 | 1.49 | Slight increase due to volume gains |
| 2025 | 1.58 | Continued growth, mature generics segment |
| 2026 | 1.66 | Price stabilization, emerging markets growth |
| 2027 | 1.75 | Market saturation |
Competitive Landscape
- Top manufacturers: Pfizer, Teva Pharmaceuticals, Mylan, Sun Pharmaceutical.
- Generic dominance: 70-80% of sales stem from generics.
- Patent protections: Pfizer’s Procardia XL expired in 2016; newer patents on sustained-release formulations have limited immediate patent cliffs.
- Pipeline activity: Minimal development of new Nifedipine ER formulations. Focus on bioequivalent generics.
Regulatory Overview
- FDA: Approves both branded and generic forms, with bioequivalence requirements.
- EMA (Europe): Similar standards; approval of biosimilars is uncommon.
- Regional policies: Patent protections vary; India and China are primary producers of generics with shortened patent terms.
Key Takeaways
- The global Nifedipine ER market is expected to grow at a CAGR of around 6% until 2028.
- Prices are stabilizing due to the proliferation of generics; annual price declines of 2-3% are typical.
- Market growth is driven by aging populations, increased chronic disease prevalence, and regional expansion.
- Competition among multiple manufacturers has created a commoditized landscape, pressuring margins.
- Regional price differences persist due to varying regulatory and reimbursement environments.
FAQs
1. What factors influence Nifedipine ER pricing?
Pricing is affected by patent status, competition, regional regulations, manufacturing costs, and reimbursement policies.
2. How does patent expiration impact market dynamics?
Patent expiration allows generic manufacturers to enter, lowering prices and expanding market volume.
3. Which regions are expected to see the highest growth?
Emerging markets in Asia, Latin America, and Africa will see accelerated growth due to increasing healthcare infrastructure.
4. What are the main competitors to Nifedipine ER?
Other dihydropyridine calcium channel blockers like amlodipine, along with other antihypertensive classes, compete indirectly.
5. Are there upcoming regulatory changes that could affect prices?
Post-pandemic shifts in patent law and increased biosimilar and generic approvals could further influence pricing and market share.
References
[1] MarketWatch. (2023). Global calcium channel blocker market size. Retrieved from https://www.marketwatch.com
[2] IQVIA. (2022). Global cardiovascular drugs sales report. Retrieved from https://www.iqvia.com
[3] U.S. Food and Drug Administration (FDA). (2022). Generic drug approval process. Retrieved from https://www.fda.gov
[4] European Medicines Agency. (2022). Regulatory landscape for cardiovascular drugs. Retrieved from https://www.ema.europa.eu
[5] World Health Organization. (2022). Cardiovascular disease data. Retrieved from https://www.who.int
More… ↓
