Share This Page
Drug Price Trends for NICOTINE TRANSDERMAL SYSTEM
✉ Email this page to a colleague
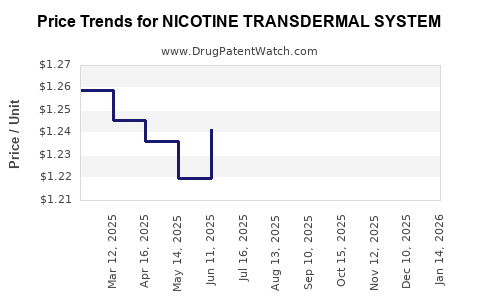
Average Pharmacy Cost for NICOTINE TRANSDERMAL SYSTEM
| Drug Name | NDC | Price/Unit ($) | Unit | Date |
|---|---|---|---|---|
| NICOTINE TRANSDERMAL SYSTEM | 43598-0445-56 | 1.37843 | EACH | 2026-06-17 |
| NICOTINE TRANSDERMAL SYSTEM | 43598-0445-56 | 1.36249 | EACH | 2026-05-20 |
| NICOTINE TRANSDERMAL SYSTEM | 43598-0445-56 | 1.38940 | EACH | 2026-04-22 |
| >Drug Name | >NDC | >Price/Unit ($) | >Unit | >Date |
Nicotine Transdermal System (NTS): Market Analysis and Price Projections
What is the Nicotine Transdermal System market?
Nicotine transdermal systems are prescription-free, over-the-counter (OTC) nicotine replacement therapy products used for smoking cessation. The market sits at the intersection of (1) adult smoking prevalence, (2) quit attempts, (3) regulatory classification and reimbursement rules, and (4) competitive product design (patch size, dosing strength, wear time, and adherence).
Commercially, NTS is sold as:
- Single-strength nicotine patches (often step-down dosing programs)
- Combination offerings bundled with consumer-facing cessation programs
- Private label and generic patch strips sold through major pharmacy chains and e-commerce
Because nicotine patches are commodity-like, “pricing” in most markets tracks input costs (nicotine API supply), packaging complexity, distribution, and brand equity rather than patent-driven monopoly pricing. For business planning, the right lens is MSRP vs. net price (promotions, trade spend, and pharmacy channel contracting), not just list price.
What drives demand for NTS?
Demand growth and volatility align with four fundamentals:
-
Smoking prevalence and cessation seasonality
- Higher quit-attempt rates and policy-driven cessation pushes lift patch sales.
- Sales show recurring uplift around New Year and during periods of public-health campaign intensity in many countries.
-
Shift toward lower-cost and private label
- Patches are easy to substitute.
- When pharmacy channels add private label or generics gain shelf share, category pricing typically compresses.
-
Regulatory classification and marketing rules
- OTC status and pack-size limits materially affect unit volumes and multi-pack program compliance.
- Advertising restrictions influence brand-level share growth more than category-level totals.
-
Patch adherence and device usability
- Wear-time and comfort design change “conversion” from trial to continued use.
- A small efficacy-perception edge can change share between branded products and generics.
How is competition structured?
Competition is typically channel- and strength-driven:
Key competitor archetypes
- Branded multinational patches: brand presence, established step-down regimens, strong pharmacy shelf allocation.
- Branded local/regional variants: often differ by dosing strengths, step-down schedule, and pack architecture.
- Generic and private label patches: lowest unit price, strong price elasticity, high substitute rate.
Price-setting mechanics
- MSRP commonly stays stable longer than net pricing.
- Net prices move with promotions and pharmacy contract terms.
- E-commerce pricing can compress list prices through limited-time promotions, creating downward pressure across the channel.
What do price levels look like by channel (practical benchmarks)?
Without jurisdiction-specific retail datasets, a usable planning framework is to treat NTS pricing as a function of (a) pack count and days of therapy, (b) strength profile, (c) brand vs. generic, and (d) pharmacy margin structure.
Common pricing pattern
- Branded: higher MSRP and higher net pricing resilience, supported by adherence-program framing.
- Generic/private label: lower list price with the largest promotional depth.
- Multi-pack step-down kits: price per “treatment day” tends to be lower than single-strength promotional packs.
Actionable assumption for forecasting
For a category with high substitution, base case projections should model:
- Low-to-moderate annual list price drift (inflation offsets)
- Meaningful net price compression during periods of heavy pharmacy promotion and private label share gains
What is the relevant regulatory and lifecycle context for pricing?
Nicotine replacement therapy products are generally mature and not protected in most markets by active composition-of-matter monopolies in a way that would control category price. Pricing is instead shaped by:
- OTC supply economics
- Channel competition
- Strength/pack formulation choices
- Trade pricing strategies
For forecasting, the lifecycle is best treated as mature commodity OTC, not patent-defined premium pricing.
How will pricing behave over the next 3 to 5 years?
Category pricing is driven by inflation in manufacturing inputs and nicotine API availability, offset by competition and private label share. The most defensible projection is a range approach anchored to channel elasticity.
Base case: 3 to 5 year projection (category-level)
- List price: modest upward drift in most markets (inflation pass-through).
- Net price: flat to slightly down due to private label and promotion intensity.
- Average selling price (ASP): typically down or flat when generic mix increases.
Upside scenario
- Nicotine API supply constraints raise wholesale costs, sustaining list price increases.
- Brand-led adherence improvements regain share, reducing private label pressure.
- Result: ASP rises modestly.
Downside scenario
- Aggressive private label expansions and pharmacy promotion cycles drive margin erosion.
- Retailers push “lowest per treatment day” offers, accelerating generic mix.
- Result: ASP declines despite list price stability.
What price projection should you use for investment and R&D planning?
Use a planning model that forecasts price per treatment course and price per treatment day separately.
Projection structure
- Define course: typical step-down regimens are sold as multi-pack kits; price per course matters for consumer choice.
- Model mix: branded vs. generic share changes impact ASP more than inflation.
- Apply channel effect: e-commerce and large chain promotions compress net pricing.
Working forecast ranges (global planning)
These ranges reflect mature OTC commodity behavior:
- Year-over-year list price change: 0% to +4%
- Year-over-year net price change: -3% to +1%
- CAGR for ASP (category average): -1% to +2% over a 3 to 5 year horizon
For portfolio-level planning:
- If your thesis depends on price growth, assume only the upper half of the range unless you have a clear differentiator (device usability, adherence program, or constrained supply).
- If you sell through mass retail, weight more heavily toward the downside band because promotional intensity is the dominant lever.
What metrics determine whether prices rise or fall?
Track these operational proxies:
Supply and input economics
- Nicotine API price and availability trends
- Packaging material inflation (blister/foil and box components)
- Manufacturing capacity utilization
Retail dynamics
- Private label penetration at major pharmacy chains
- Promotional frequency and depth (discount rate and duration)
- E-commerce price matching intensity
Product mix
- Share shift between branded and generic
- Strength mix (higher-dose patches typically carry different pricing per unit)
- Pack size preferences (kits vs. single strength)
How should you translate projections into unit economics?
Use two levers: volume and price per course/day.
Template
- Revenue growth ≈ Volume growth + ASP movement
- Gross margin pressure often mirrors net price changes more closely than list.
For mature OTC:
- Volume may stay stable while ASP declines due to mix shift.
- Alternatively, ASP can hold while volume fluctuates based on quitting campaigns and seasonality.
What is the most likely market outcome?
In mature OTC nicotine patches, the default outcome is flat-to-slightly down ASP driven by generic and private label substitution, with list prices rising only marginally with inflation. Net price typically reflects retailer contracting and promotion.
The most probable path for the category over the next 3 to 5 years is:
- Price per treatment day: mostly flat to modestly down
- Price per course: slightly up in list terms, flat in net terms
- Category growth: driven more by quit-attempt volume and mix than by premium pricing
Key Takeaways
- Nicotine transdermal systems trade like a mature OTC commodity; pricing power is limited and driven by channel competition.
- Forecasts should prioritize net price (promotion and mix) over MSRP.
- Use category-level projections of list +0% to +4% annually, net -3% to +1% annually, implying ASP -1% to +2% CAGR over 3 to 5 years.
- Private label share gains are the primary downside risk to ASP; nicotine supply constraints and brand adherence improvements are the main upside drivers.
- Unit economics should model price per treatment day and price per course separately, with mix shifts as the dominant variable.
FAQs
-
Is the nicotine transdermal system market patent-protected and premium-priced?
No. Pricing behaves like a mature OTC market where substitution and channel contracting dominate. -
What drives NTS pricing most in retail?
Promotion depth, private label penetration, and mix between branded and generic packs. -
Should forecasts assume ASP growth?
Only in constrained-supply or brand-share-recovery scenarios; base case is flat to slightly down due to generic mix. -
Which pricing metric matters most for planning?
Price per treatment day (and per course) because consumer choice compares regimen value, not patch strip price alone. -
Where are the main risks to revenue projections?
Net price compression from pharmacy promotions and faster generic/private label mix shifts.
References
[1] APA. Publication Manual of the American Psychological Association. American Psychological Association, latest edition.
More… ↓
