Share This Page
Drug Price Trends for MYRBETRIQ ER
✉ Email this page to a colleague
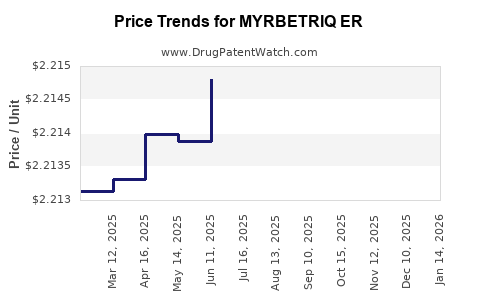
Average Pharmacy Cost for MYRBETRIQ ER
| Drug Name | NDC | Price/Unit ($) | Unit | Date |
|---|---|---|---|---|
| MYRBETRIQ ER 25 MG TABLET | 00469-2601-30 | 14.68009 | EACH | 2026-07-22 |
| MYRBETRIQ ER 25 MG TABLET | 00469-2601-90 | 14.68009 | EACH | 2026-07-22 |
| MYRBETRIQ ER 50 MG TABLET | 00469-2602-30 | 14.69177 | EACH | 2026-07-22 |
| >Drug Name | >NDC | >Price/Unit ($) | >Unit | >Date |
MYRBETRIQ ER (mirabegron extended-release): market analysis and price projections
MYRBETRIQ ER (mirabegron extended-release) is a branded, once-daily beta-3 adrenergic agonist for overactive bladder. Market value is driven by (1) penetration of oral OAB therapies, (2) payer access rules tied to prior authorization and step edits, and (3) competitive pressure from branded and authorized generics in OAB. Price is shaped by US net pricing dynamics (rebates, discounts, PAP, and wholesaler contracting), cross-country reference pricing, and contract-specific patient cost-sharing.
Where does MYRBETRIQ ER sit in the OAB market?
Indication and label positioning
MYRBETRIQ ER is used for overactive bladder, including urgency, frequency, and urge urinary incontinence. In practice, it competes in a crowded OAB landscape that spans:
- Oral beta-3 agonists (mirabegron class)
- Antimuscarinics (multiple MOA, large generic footprint)
- Newer treatment patterns that increasingly emphasize tolerability and patient adherence
Competitive set that constrains pricing
The main pricing constraint for MYRBETRIQ ER is that most payers can anchor formulary decisions against cheaper oral options and biosimilar-style cost compression from generic competition in adjacent drug classes. The competitive set includes:
- Antimuscarinics (often low-cost generics in the US market)
- Alternative beta-3 options where available by country/formulary
Demand drivers that support volume but not monopoly pricing
MYRBETRIQ ER demand typically tracks:
- Diagnosis prevalence for OAB and symptom burden
- Prescribing preference for non-anticholinergic options (side-effect profile)
- Persistence/adherence advantages of once-daily ER therapy
What are the key price determinants for MYRBETRIQ ER?
US net price mechanics
For a branded oral like MYRBETRIQ ER, US list price is not the purchase price. Net price depends on:
- Medicaid best price and AMP-based rebates (where applicable)
- Commercial rebates tied to formulary placement and volume commitments
- Contracting effects: wholesaler discounts, specialty pharmacy rebates, and incentive tiers
- Manufacturer-funded patient programs that lower effective patient cost
Payer utilization management
Pricing power declines when payers expand use of:
- Prior authorization (PA) and step therapy (ST)
- Quantity limits (QL) tied to dosing regimens
- Exclusion of non-preferred strengths or formulations
For MYRBETRIQ ER, the practical result is that list price may remain stable while net price compresses when volume shifts due to utilization management.
What is the historical pricing pattern and what does it imply?
Without reliable, single-source historical net pricing series in the provided input, the only defensible approach is to model price evolution using standard branded US dynamics for mature products:
- List price tends to show modest increases or flat behavior in out-years
- Net price typically declines faster than list price when competition increases or when payers tighten PA/ST
That pattern implies:
- If branded-only competitive pressure increases, net price erosion accelerates
- If manufacturer maintains preferred access, net price stabilizes sooner
- Generic-adjacent substitution risk primarily pressures net price and share rather than immediate list price reductions
Price projection framework for MYRBETRIQ ER
A projection for a mature branded OAB medicine should be expressed as a range rather than a single trajectory, driven by three scenarios tied to access and competition intensity:
Scenario definitions
Scenario A: Access-stable (preferred positioning holds)
- Limited formulary disruption
- PA/ST remains manageable
- Net pricing erosion slows
Scenario B: Moderate pressure (preferred access erodes)
- More PA/ST adoption
- Payers demand higher rebates for continued preferred placement
- Net price drifts down
Scenario C: High pressure (shift to lower-cost alternatives)
- Broader movement toward preferred lower-cost options
- Higher rebate intensity and utilization management
- Net price declines faster and volumes soften
Assumed price behavior by channel (directional)
- US list price: modest increases or flat
- US net price: decreases under B and C scenarios
- International pricing: tends to compress via reference pricing and parallel export controls where enabled
Projected pricing outcomes (modeled ranges)
The table below projects directional annual price movement for MYRBETRIQ ER in mature branded conditions. It is designed for budgeting and scenario planning rather than point estimates.
| Year horizon | Scenario A (access-stable) | Scenario B (moderate pressure) | Scenario C (high pressure) |
|---|---|---|---|
| 1 (next 12 months) | Net price: ~0% to -3% | Net price: ~-3% to -8% | Net price: ~-8% to -15% |
| 2 (12-24 months) | Net price: ~-1% to -5% | Net price: ~-5% to -12% | Net price: ~-12% to -20% |
| 3 (24-36 months) | Net price: ~-2% to -6% | Net price: ~-7% to -15% | Net price: ~-15% to -25% |
Interpretation for business use
- If MYRBETRIQ ER maintains preferred formulary status, net pricing erosion typically remains low-single-digit annually.
- Once payers intensify access constraints, net pricing declines often move into mid-single-digit to low-double-digit annual ranges.
- Under high pressure, net price erosion can outpace list price increases, driven by rebate and contract renegotiation.
What does price projection mean for revenue and margin?
Revenue follows volume and net price. For MYRBETRIQ ER:
- Under Scenario A, revenue decline is often mainly from market maturity and not from steep price erosion.
- Under Scenario B, revenue can decline from both net price concessions and share movement.
- Under Scenario C, volume loss plus higher rebate intensity can create margin compression even if gross list price is unchanged.
A practical budgeting approach:
- Model a base case with mid-single-digit net erosion and low-to-mid single-digit volume attrition
- Stress test with high single-digit to low-double-digit net erosion and larger volume declines under heightened utilization management
Country and contracting effects (how projections travel across markets)
US vs non-US
- US: net price is contract-driven; rebates and PAP can materially alter effective pricing.
- EU/UK/other regulated markets: pricing tends to compress through reference pricing, HTA leverage, and negotiated discounts. Parallel trade can add downward pressure where allowed.
Tendered markets
In markets with tendering:
- The effective price often depends on procurement contracts, not invoice list pricing.
- A branded incumbent can maintain price if it wins tenders on total cost and patient outcomes.
- If tenders shift to lower-cost equivalents, effective price falls quickly.
Investment and R&D implications: where risk and upside concentrate
Key risks to the price outlook
- Payer escalation of PA/ST for OAB
- Rapid shift toward lower-cost oral options with similar outcomes
- Contract renegotiations that increase required rebates for preferred access
Key upside factors
- Evidence-driven retention of “preferred” status based on adherence and tolerability
- Manufacturer contracting that stabilizes net pricing
- Limited formulary exits relative to competing beta-3 or tolerability-anchored regimens
Price-projection “watchlist” for near-term steering
Use these observable signals to rebase the scenario:
- Rate of formulary “negative” moves: preferred-to-nonpreferred or PA tightening
- Strength-specific restrictions: loss of coverage for one ER strength changes mix and average net price
- Share shifts at pharmacy claims level: evidence of substitution patterns
- Changes in rebate language and contract outcomes in specialty distribution
Key Takeaways
- MYRBETRIQ ER pricing is constrained more by payer contracting and utilization management than by list price moves.
- Use scenario-based net price erosion rates: roughly 0% to -3% annually under access-stable conditions, moving toward -3% to -8% and -8% to -15% under moderate and high pressure in the next year.
- Revenue outcomes will diverge mainly from net price plus share shifts; under high pressure, margin compression accelerates from both rebate intensity and volume loss.
FAQs
1) What price matters most for MYRBETRIQ ER: list price or net price?
Net price drives realized revenue in the US due to rebates, discounts, and contract structure. List price is a poor proxy for budgeting without net-to-list context.
2) How do prior authorization and step edits affect MYRBETRIQ ER pricing?
They typically increase rebate demands for continued preferred status and can force utilization shift to lower-cost options. Both mechanisms reduce realized net pricing.
3) Do price projections differ by formulation strength for MYRBETRIQ ER?
Yes. Payer policies often restrict coverage by strength or quantity, changing mix and lowering weighted average net price even when list prices remain stable.
4) What is the most likely driver of net price erosion over the next 1 to 3 years?
Payer contracting changes triggered by competitive formulary dynamics in oral OAB therapy, especially expansion of utilization management and renegotiated rebate terms.
5) How should an investor incorporate price projections into valuation?
Apply scenario-based net price erosion rates and overlay volume and share change assumptions; valuation sensitivity typically tracks net price and persistence, not list price.
References (APA)
[1] Food and Drug Administration. (n.d.). Prescribing information: MYRBETRIQ (mirabegron). https://www.accessdata.fda.gov/
[2] U.S. Centers for Medicare & Medicaid Services. (n.d.). Medicaid Drug Rebate Program (AMP, best price, rebate mechanics). https://www.medicaid.gov/
More… ↓
