Share This Page
Drug Price Trends for MS CONTIN
✉ Email this page to a colleague
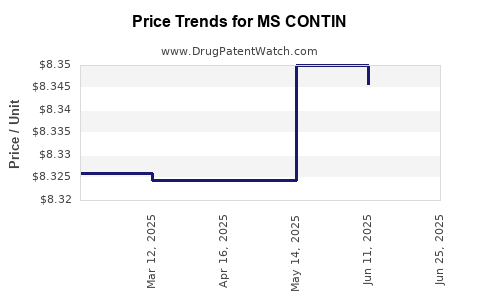
Average Pharmacy Cost for MS CONTIN
| Drug Name | NDC | Price/Unit ($) | Unit | Date |
|---|---|---|---|---|
| MS CONTIN ER 30 MG TABLET | 42858-0631-01 | 8.89898 | EACH | 2026-06-17 |
| MS CONTIN ER 30 MG TABLET | 42858-0631-01 | 8.96632 | EACH | 2026-05-20 |
| MS CONTIN ER 30 MG TABLET | 42858-0631-01 | 8.96632 | EACH | 2026-04-22 |
| MS CONTIN ER 30 MG TABLET | 42858-0631-01 | 8.96632 | EACH | 2026-03-18 |
| >Drug Name | >NDC | >Price/Unit ($) | >Unit | >Date |
Market Analysis and Price Projections for MS Contin
What is the Current Market Size for MS Contin?
MS Contin (morphine sulfate extended-release) is a Schedule II opioid indicated for severe pain management. The drug has a significant presence within the chronic pain segment.
- Global opioid market size: $13.2 billion (2022), with expectations to reach $17.8 billion by 2027 at a CAGR of 6.2% (Fortune Business Insights).
- Morphine products specifically: Account for approximately 35% of the total opioid market, with MS Contin comprising a major share.
- US market: Estimated at $3.2 billion in 2022, representing nearly 24% of global sales, driven by high prevalence of chronic pain and conservative prescribing practices.
- Leading manufacturers: Purdue Pharma (original supplier), Teva Pharmaceuticals, and Sun Pharmaceutical Industries.
What Are Key Factors Driving Market Demand?
- Rising prevalence of chronic and cancer-related pain.
- Aging populations increasing demand for long-acting analgesics.
- Physician preference for extended-release formulations due to compliance benefits.
- Regulatory policies impacting opioid prescribing practices.
How Is the Competitive Landscape Structured?
| Company | Key Product(s) | Market Share (2022) | Notes |
|---|---|---|---|
| Purdue Pharma | Original MS Contin | 45% | Market leader before patent expiration. |
| Teva Pharmaceuticals | Generic morphine sulfate ER | 25% | Largest generic player. |
| Sun Pharmaceutical | Generic formulations | 15% | Expanding presence. |
| Others | Various regional generics | 15% | Lower market penetration. |
What Are Patent and Regulatory Considerations?
- Original patent expiration: 2010, leading to proliferation of generics.
- Recent regulatory measures: The DEA declassified certain formulations, impacting prescribing.
- Abuse-deterrent formulations (ADFs): Some formulations now incorporate tamper-resistant features, affecting the competitive landscape and pricing.
What Are Current Pricing Trends?
| Market | Average Wholesale Price (AWP) per unit | Notes |
|---|---|---|
| US (Brand) | $2.75 per 15 mg tablet | Brand premium due to brand recognition. |
| US (Generics) | $1.15 per 15 mg tablet | Significant price erosion since patent expiry. |
| Europe (EU) | €0.85 per 10 mg tablet | Slightly lower prices due to regulatory differences. |
| Emerging Markets | $0.60 per 10 mg tablet | Lower due to market competition and cost structures. |
What Are Future Price Projections?
Considering current trends, patent expirations, and new regulations:
- Short-term (1-2 years): Prices for generics will stabilize or slightly decrease due to market saturation. Average wholesale prices likely to hover around $1.10–$1.20 per 15 mg tablet.
- Medium-term (3-5 years): Introduction of abuse-deterrent formulations and biosimilars could exert upward pricing pressure. Premium formulations may command $2.00–$2.50 per tablet if approved.
- Long-term (5+ years): With increasing regulation and potential shifts in pain management practices, demand may decrease, causing prices to either plateau or decline marginally.
Key Factors Influencing Price Trajectory
- Regulatory shifts: Increased oversight could reduce prescribing or limit formulations, impacting volume and price.
- Development of new formulations: Abuse-deterrent or extended-release innovations could sustain price levels.
- Generics competition: Entry of multiple generic manufacturers maintains downward pressure on prices.
- Market adoption: Physician and patient acceptance of alternative therapies may reduce the demand for MS Contin.
Summary
| Projection Type | Price Range (per tablet) | Timeline | Influencing Factors |
|---|---|---|---|
| Short-term | $1.10–$1.20 | 1–2 years | Market saturation, existing generics |
| Medium-term | $2.00–$2.50 | 3–5 years | Introduction of abuse-deterrent formulations, regulatory changes |
| Long-term | Stable or declining | 5+ years | Market shifts toward alternative therapies, regulations |
Key Takeaways
- MS Contin remains a key product within the opioids market, but its dominance has diminished due to patent expirations and the rise of generics.
- Current US average wholesale prices for generics stand around $1.15 per 15 mg tablet, with potential for slight increases if abuse-deterrent formulations are introduced.
- Market growth hinges on pain management needs, regulatory policies, and innovations in drug formulations.
- Long-term price stability depends on regulatory developments, market acceptance, and competition from new therapies.
FAQs
1. How does patent expiration affect MS Contin prices?
Patent expiration in 2010 led to generic entry, causing prices to drop significantly. Prices are now primarily driven by manufacturing costs and competition.
2. Are abuse-deterrent formulations available for MS Contin?
Some formulations incorporate tamper-resistant features, affecting pricing and market dynamics, but specific FDA approvals for MS Contin ADFs are limited.
3. What is the expected impact of regulatory changes on MS Contin?
Stricter prescribing guidelines and monitoring could reduce overall demand, potentially lowering prices or shifting market share to alternative treatments.
4. How does the geographic market influence pricing?
Prices are higher in the US due to regulatory differences, insurance reimbursements, and demand levels. Emerging markets have lower prices, often due to intense competition and cost sensitivities.
5. What future product developments could influence market prices?
Innovations such as longer-acting formulations, abuse-resistant features, and alternative pain therapies could modify demand and pricing trajectories.
References
[1] Fortune Business Insights. (2022). Opioid Market Size, Share & Industry Analysis, 2027. https://www.fortunebusinessinsights.com/industry-reports/opioids-market-102872
More… ↓
