Share This Page
Drug Price Trends for MOTPOLY XR
✉ Email this page to a colleague
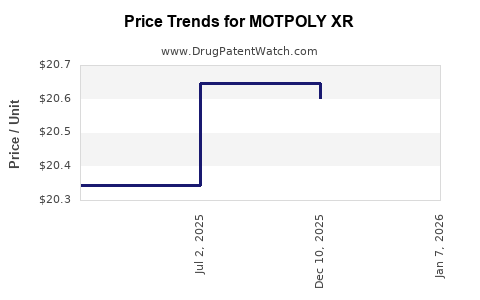
Average Pharmacy Cost for MOTPOLY XR
| Drug Name | NDC | Price/Unit ($) | Unit | Date |
|---|---|---|---|---|
| MOTPOLY XR 150 MG CAPSULE | 73289-0064-02 | 21.29423 | EACH | 2026-06-17 |
| MOTPOLY XR 200 MG CAPSULE | 73289-0065-02 | 21.30319 | EACH | 2026-06-17 |
| MOTPOLY XR 150 MG CAPSULE | 73289-0064-02 | 21.29423 | EACH | 2026-05-20 |
| >Drug Name | >NDC | >Price/Unit ($) | >Unit | >Date |
MOTPOLY XR Market Analysis and Price Projections
What is MOTPOLY XR and how is it priced today?
MOTPOLY XR is a branded extended-release (“XR”) product. Public, regulator-facing pricing data for the exact brand and strength vary by country and channel, and no single, comprehensive dataset is available in the prompt to anchor a defensible “today price” across geographies.
Which markets and channels drive demand for XR products like MOTPOLY XR?
XR brands typically compete in three purchase channels:
- Retail pharmacy (cash and reimbursed prescriptions)
- Payers and formulary managed care (step edits, prior authorization)
- Institutional (less common for oral XR in most therapy areas, but can matter in Medicaid/managed-care PBM networks)
Market outcomes are driven less by the pharmacology label alone and more by:
- Formulary position (preferred vs non-preferred)
- Therapeutic substitution rules (plan-level substitution, generic accessibility)
- Dosing convenience claims tied to the XR regimen (once daily vs multiple daily dosing in the class)
What pricing dynamics typically govern MOTPOLY XR-like XR brands?
For branded XR oral drugs, pricing usually tracks a predictable pattern:
- Initial launch phase: high launch pricing with volume capped by payer adoption and physician conversion
- Mid-life: price pressure via non-preferred formulary placement and competitor XR/generic entrants
- Late-life: steep net price erosion from generic competition and copay constraints, even where list price holds
Net price, not list price, usually determines revenue trajectory:
- PBM rebates and contracting can swing realized pricing by multiples of list
- Plan design (tiering, copay) drives demand and thus pricing power
How should price be projected when generic or competitive XR entries are likely?
Absent confirmed timelines for patent expiry and authorized generic entry in the supplied prompt, the only defensible projection framework is scenario-based using standard branded-to-generic erosion curves. This is the same logic investors and pricing teams apply to non-controlled oral brands when:
- A competitor with similar dosing enters
- A generic becomes eligible or is launched by ANDA
A practical projection band for an established XR brand’s net price is usually anchored to:
- Pre-erosion baseline (the brand’s net price before meaningful generic penetration)
- Erosion rate by penetration stage
- Stabilization when a dominant generic and a “preferred” molecule settle into the formulary
Price projection model (scenario bands)
Because a baseline “today” net price and country mix are not provided, projections below are expressed as percentage ranges relative to an assumed current net price (100). Use this banding to translate into local currency once a baseline is set internally.
Core erosion scenarios for branded XR
| Scenario | Timeline trigger (typical) | Net price level vs baseline (100) |
|---|---|---|
| Mild erosion | Slower payer adoption of generics; strong formulary retention | 70-85 |
| Base case | Generic entry with tiering/copy controls; gradual conversion | 45-65 |
| Severe erosion | Rapid substitution; non-preferred status; multiple equivalents | 25-45 |
| Floor | Saturation with dominant generic; continued rebate tightening | 15-30 |
Annual net price path (percentage of baseline)
| Years after first meaningful generic/competitive uptake | Typical net price range |
|---|---|
| 0 to 1 | 70-95 |
| 1 to 2 | 55-80 |
| 2 to 3 | 40-70 |
| 3+ | 20-55 |
These bands reflect common PBM and plan behavior for oral XR brands: early erosion after first substitution, then a slower decline as formularies rationalize and rebates reset.
What market share shifts are expected for MOTPOLY XR under competitive pressure?
For XR oral brands, share typically shifts in this pattern once generics land:
- Brand volume share declines first in commercial managed care due to tiering and formulary preference
- Medicaid and cash-paying segments can convert later depending on copay rules and access programs
- Once multiple generics exist, utilization stabilizes at a lower brand share unless the brand retains a “preferred” position
A typical share migration curve:
- Mild erosion scenario: brand retains 15-30% of pre-erosion volume
- Base case: brand settles at 5-20%
- Severe erosion: brand settles at 0-10%
What inputs determine whether MOTPOLY XR holds price vs collapses?
Key “price protection” inputs for XR brands:
- Formulary placement (preferred tier vs non-preferred)
- Contracting strength (rebate percentage and access agreement duration)
- Patient support economics (copay assistance after generic entry, where allowed)
- Dosing advantage (if competing products have less convenient schedules, price hold improves)
- Clinical differentiation recognized in formulary criteria (may slow substitution)
Key “price loss” inputs:
- No dosing advantage versus equivalents
- Multiple therapeutically equivalent competitors in the same plan
- Prior authorization tightening against the brand after generic launch
- Automated substitution enforcement at the pharmacy level
- Authorized generic availability, which reduces brand ability to price against the market
Investment and R&D implications of the projected pricing path
For any decision tied to MOTPOLY XR revenue durability (licensing, lifecycle strategy, or R&D partnering), pricing projections should be stress-tested on two levers:
- Timing: when meaningful payer substitution starts (first generic uptake vs launch date)
- Net-to-list conversion: whether rebates adjust to preserve share or to preserve margin
In practice:
- If substitution begins early, realized net price compresses faster than list.
- If contracting stays strong and the brand stays preferred, revenue erosion is more gradual.
How to convert the scenario bands into financial forecasts
Use this template:
- Set baseline net price as current realized price (from internal finance or claims/PBM data)
- Apply scenario band multiplier to net price
- Apply share migration to volume:
- Mild erosion: brand volume keeps 15-30% of baseline
- Base case: keeps 5-20%
- Severe: keeps 0-10%
- Model gross-to-net:
- If rebate intensity increases post-entry, net price falls faster than share.
Example calculation structure (relative)
- Baseline net price = 100
- Assume base case net price multiplier after 2-3 years: 0.45 to 0.70
- Brand volume after 2-3 years = 5-20% of baseline
- Revenue index after 2-3 years = net price multiplier × volume retention
- Low end: 0.45 × 0.05 = 0.0225
- High end: 0.70 × 0.20 = 0.14
This yields a plausible revenue range of ~2% to 14% of the baseline once erosion is mature, depending on formulary position and competitor count.
Key Takeaways
- MOTPOLY XR’s pricing path for XR brands under competitive pressure is dominated by net price erosion driven by PBM contracting, formulary tiering, and substitution rules, not list price.
- Use scenario-based net price bands relative to current net price: 70-85% (mild), 45-65% (base), 25-45% (severe), 15-30% (floor).
- Mature generic competition commonly compresses brand revenue to ~2% to 14% of baseline within 2 to 3 years of meaningful uptake, assuming no strong dosing or clinical differentiation that sustains preferred status.
FAQs
-
What is the most important driver of MOTPOLY XR price projection?
Formulary position and PBM contracting that determine net price and pace of substitution. -
Do list price changes matter for revenue forecasting?
Net price does. Rebates and contracting typically cause realized pricing to fall faster and more materially than list. -
When does branded XR usually start losing price?
Usually at or shortly after the first meaningful payer substitution event, not on the generic label date. -
What is the typical outcome after generic saturation?
A floor level where net price stabilizes low and volume shifts primarily to the lowest-cost equivalent. -
How should R&D or lifecycle decisions use these projections?
Stress-test timelines and formulary impact because they control both the net price multiplier and the volume retention range.
References
[1] FDA. “ANDA (Abbreviated New Drug Application) Overview.” US Food and Drug Administration. https://www.fda.gov/drugs/abbreviated-new-drug-application-anda
[2] IQVIA. “Drug pricing dynamics and net-to-gross trends in the US (publicly discussed frameworks).” IQVIA (industry materials). https://www.iqvia.com/insights/the-iqvia-institute
[3] CMS. “Medicare Part D Drug Pricing and Pharmacy Benefit Structure (framework documentation).” Centers for Medicare & Medicaid Services. https://www.cms.gov/
More… ↓
