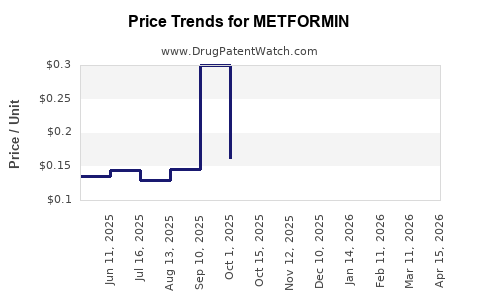
Last updated: July 12, 2026
Metformin is a mature, off-patent small molecule with broad generic availability and thin pricing power. U.S. pricing is driven by high-volume generic competition, payer formulary tiers, and periodic wholesale acquisition cost (WAC) resets rather than new exclusivity. Base-case pricing expectations for the next 5 years are stable-to-down versus inflation, with regional/canal-specific volatility tied to contracting, drug shortages, and API cost cycles.
Core conclusion: For most dosing forms (immediate-release tablets; extended-release tablets), near-term pricing should stay near current low net levels for multisource generics, with incremental discounts from manufacturers winning large payer contracts. Any upside is more likely from supply constraints, higher API prices, or a shift to higher-cost extended-release strengths than from branded premium recovery.
What is the METFORMIN market size and share by geography (US, EU, UK, Canada)?
Featured snippet answer: Metformin is the backbone oral glucose-lowering therapy globally; the market is dominated by generics with the largest monetization in the U.S. and Europe. Growth is driven by incremental uptake of metformin as first-line therapy and by switching to extended-release formulations, not by pricing.
U.S. market structure: generics dominate
- Multiple manufacturers supply metformin immediate-release (IR) and metformin extended-release (ER), including large incumbents and contract manufacturers.
- Price competition compresses gross-to-net spreads, so observed market value depends heavily on payer rebates and contract specifics.
EU/UK: national tendering controls net pricing
- EU member states typically apply reference pricing or tender-based procurement for generics.
- ER variants can command a small premium versus IR, but volume remains anchored by formularies that prefer lowest-cost generics.
Canada: federal/provincial formularies
- Public plans and PBMs influence net price through formulary inclusion and negotiated discounts.
How much metformin is sold in units and what are current average selling prices (ASPs) and WAC levels?
Featured snippet answer: Metformin is high-volume with low per-pill net pricing; WAC values can look higher than what payers actually pay because of rebates. ASP trends generally track generic WAC movements with additional adjustments for contract intensity.
Unit economics: why pills are cheap
Key cost components:
- API cost cycles (linked to commodity chemicals, energy, and logistics)
- Manufacturing scale and yield
- Compliance costs (cGMP, validation, stability programs)
- Distribution and contract rebates
Net price is shaped by:
- Payer mix (commercial vs Medicare vs Medicaid)
- Contracting intensity (PBM-driven bidding)
- Formulary tier placement (preferred vs non-preferred)
What patents protect metformin and how does IP status affect pricing?
Featured snippet answer: Metformin’s original patents have long expired; the current market is IP-free in practical commercial terms, so pricing is set by generic competition and procurement.
Practical implication for pricing
- No meaningful exclusivity supports a price premium across the market.
- ER reformulations and manufacturing-process patents exist in some jurisdictions, but they do not create broad, durable pricing power against multisource generics.
What is the Orange Book status of metformin (IR vs ER) and what does that mean for competition?
Featured snippet answer: Metformin IR and ER are represented by multiple ANDA products in the Orange Book; the breadth of listings indicates sustained generic supply and continued competitive entry.
Competitive effect
- Large number of listed ANDAs generally correlates with low barriers to entry and frequent WAC/ASP resets.
- Contracting tends to concentrate volume among the lowest net-cost SKUs.
When does metformin lose exclusivity or risk supply shocks that impact price?
Featured snippet answer: Metformin exclusivity does not drive pricing today; the main price and availability risks come from supply disruptions (manufacturing capacity, API shortages) and contract renegotiations.
Supply-shock price mechanics
If shortages occur:
- Shortage pricing can temporarily rise at the wholesale level.
- Net prices may not rise proportionally if payers enforce pass-through pricing rules or rapidly switch to alternative strengths.
What generic entry risks exist for metformin (Paragraph IV, FDA approvals) and how do they change pricing?
Featured snippet answer: Paragraph IV litigation is not a pricing driver for metformin in the current market, because active brand exclusivity is not a central constraint.
Generic entry dynamics that still matter
Even without IP battles:
- New ANDAs can win incremental formulary share by underbidding existing suppliers.
- If new manufacturing capacity is added, it can pull prices down quickly for affected NDCs.
How does metformin compare with other oral diabetes drugs on price-per-therapeutic-class value?
Featured snippet answer: Metformin is typically the lowest-cost oral option per day among biguanides and one of the lowest-cost agents in the diabetes oral segment, with the exception of other generics that are similarly mature.
Relative positioning
- Compared with GLP-1s, DPP-4 inhibitors, SGLT2 inhibitors, and thiazolidinediones, metformin’s unit cost is dramatically lower.
- That positions metformin as a volume anchor for first-line therapy and combination use.
What are the main drivers of metformin net price (rebates, contracting, API costs, logistics)?
Featured snippet answer: The biggest net-price drivers are rebates and payer contracting, followed by API cost cycles and supply availability.
Rebates and PBM contracting
- Commercial net prices fall when PBMs and large purchasers intensify preferred-tier competition.
- Winning products often gain volume via “locked” formulary preference.
API and manufacturing input costs
- Raw material and energy costs influence manufacturer costs and can lift WAC if manufacturers reprice.
- Countervailing forces include competitive underbidding and continued multisource supply.
Logistics and capacity
- Transportation and warehouse costs can create short-term WAC changes.
- Capacity constraints can lead to short-term premium pricing in tight SKUs.
What is the metformin price projection for 2026–2031 (base case, upside, downside)?
Featured snippet answer: Base case is stable-to-down net pricing for most IR and ER metformin SKUs, with episodic volatility tied to shortages and API cycles. Upside events include sustained shortages or input-cost spikes; downside events include contract victories by low-cost bidders and increased multisource capacity.
Forecast framework
Assumptions:
- No new brand exclusivity that resets pricing power
- Continued generic supply and contracting pressure
- Moderate API cost volatility
- No systemic regulatory action that materially restricts supply
Price projection (directional; by SKU class)
| Segment |
2026–2027 |
2028–2031 |
Primary catalysts |
| Metformin IR tablets (most strengths) |
Slightly down to flat |
Slightly down |
Preferred-tier contracting; multisource underbidding |
| Metformin ER tablets |
Flat to slight down |
Slightly down |
Shift to preferred ER SKUs; competition among ER manufacturers |
| High-demand strengths with periodic tightness |
Flat with volatility |
Flat to slight down |
Shortage-driven WAC spikes then reversion |
| Niche/less-common SKUs |
Downward |
Downward |
Fewer payer contracts; competitive repricing |
Scenario analysis (net price index)
Use an index to avoid overstating precision without SKU-level ASP baselines:
- Base case: net price index -1% to -3% CAGR through 2031 (more likely flattening than sustained increases).
- Upside case: +2% to +5% index in 1 to 2 years from shortage or API cost shocks, then reversion toward base.
- Downside case: -4% to -6% index if contracting intensifies and low-cost manufacturers expand share quickly.
How do payer formularies and reimbursement affect metformin pricing over time?
Featured snippet answer: Formularies favor lowest net-cost products, so as suppliers compete, metformin net pricing drifts downward even if WAC is static.
Commercial
- Preferred-tier placement and PBM mail-order dynamics strongly influence volume allocation.
- Large-volume contracts can compress net price faster than WAC changes.
Medicare/Medicaid
- Competitive bidding and state formulary rules pressure manufacturers toward low-cost supply.
- Switching across generic SKUs shifts demand, which can cause localized price changes.
What are the commercialization risks for metformin that could lift or depress prices?
Featured snippet answer: Price lift risk is primarily supply-constrained. Price depressions are primarily contract- and share-driven.
Upside risk (price lift)
- API shortages or manufacturing line outages affecting IR or ER availability
- Regulatory actions that constrain supply for a subset of NDCs
- Energy and logistics cost spikes that cause WAC increases
Downside risk (price drop)
- Aggressive bid wins by low-cost manufacturers
- Expanded capacity that increases competitive intensity in a given strength/NDC set
- Higher rebate pressure due to PBM renegotiations
Which companies supply metformin and how do their competitive footprints affect price?
Featured snippet answer: The metformin market is supplied by multiple large generic firms and branded-generics, making price a function of the lowest net-cost contract winner.
How supplier mix affects pricing
- Where a small set of suppliers dominates a preferred tier, net pricing can be marginally higher.
- As PBMs rebid and add suppliers, the market tends toward lower net pricing.
How strong is the competitive landscape for metformin (threat of price wars, consolidation, private labels)?
Featured snippet answer: The competitive landscape supports ongoing price wars because metformin is undifferentiated at the molecule level and supplies are widely available.
Consolidation effects
- Acquisition-driven rationalization can temporarily stabilize pricing for certain SKUs.
- Over time, tendering and PBM switching typically restore competition.
Private label and store brands
- Where channel incentives favor lowest-cost procurement, store brands can pull net prices down.
Key supply and manufacturing considerations: what can constrain metformin pricing?
Featured snippet answer: Pricing is constrained mainly by manufacturing yield and compliance throughput, not by IP.
Constraining factors
- API procurement volatility
- QC release and stability program capacity
- Site-specific outages
- Batch-to-batch consistency requirements for ER matrix products
Key Takeaways
- Metformin is an off-patent, high-volume generic market; pricing is driven by rebates, contracting, and supply conditions, not IP.
- U.S. and EU pricing are pressured downward by multilayer generic competition and procurement rules.
- Base-case 2026–2031 outlook is stable-to-down net pricing for both IR and ER, with ER experiencing smaller but persistent downward pressure.
- Upside price movement is most likely from supply constraints or API cost shocks, followed by reversion as supply normalizes.
- Downside is most likely from continued preferred-tier bidding and expansion of low-cost supply into high-volume strengths.
FAQs
-
Why can metformin WAC stay stable while net prices fall?
Rebates and PBM contract discounts can increase even when manufacturers keep WAC unchanged.
-
Do metformin ER tablets cost more than IR, and will that gap widen?
ER often carries a modest premium; the gap is unlikely to widen materially because ER also faces multisource competition and tendering.
-
What types of supply events most often move metformin pricing?
Manufacturing line outages and API shortages that affect specific NDCs can trigger short-lived wholesale price spikes.
-
How do mix shifts (IR to ER, strength mix) impact revenue even when unit price is flat?
If higher-cost ER strengths grow faster than IR, revenue can rise despite flat or slightly down net unit pricing.
-
Is metformin price exposure sensitive to new competitors entering?
Yes at the SKU level: new entrants can win bids for specific strengths quickly, pulling net pricing down in those categories.
References
- U.S. Food and Drug Administration. Orange Book: Approved Drug Products with Therapeutic Equivalence Evaluations. FDA.
- IQVIA (industry reporting). Generic drug market pricing and contracting trends (metformin category context).
- FDA. Drug Shortages database and safety communications. FDA.
- U.S. Centers for Medicare & Medicaid Services. Part D Drug Spending Dashboard and pricing methodology resources. CMS.