Last updated: February 20, 2026
What Is the Current Market Size for Mefenamic Acid?
The global market for nonsteroidal anti-inflammatory drugs (NSAIDs), which includes mefenamic acid, was valued at approximately USD 17 billion in 2022. Mefenamic acid accounts for a 2% to 3% share of this market, translating to an estimated USD 340 million to USD 510 million in 2022.
The drug's primary markets are North America, Europe, and Asia-Pacific. In North America, the demand is driven by prescription-based use for dysmenorrhea and arthritis. Europe sees similar demand, with initial growth in OTC sales. Asia-Pacific presents a high growth rate due to increasing awareness and adoption, especially in India and China, where NSAIDs see widespread use.
What Are the Growth Drivers and Challenges?
Growth Drivers
- Rising prevalence of chronic pain conditions and dysmenorrhea.
- Increased OTC availability in emerging markets.
- Expansion of manufacturing capacity by generic and branded companies.
- Off-label use in low-income regions where healthcare access is limited.
Challenges
- Stringent regulatory approval processes, especially concerning safety profiles.
- Competition from other NSAIDs with better safety profiles, such as ibuprofen and naproxen.
- Growing awareness of potential adverse effects like gastrointestinal bleeding and cardiovascular risks diminishes prescribing inclination.
How Is the Regulatory Environment Shaping the Market?
Mefenamic acid marketing faces varied regulatory frameworks:
- In North America, it is primarily available by prescription.
- In Europe, some countries restrict OTC sales.
- In India, over-the-counter availability is permitted, leading to higher usage.
Regulatory bodies such as the FDA (U.S.) and EMA (Europe) emphasize safety profile reassessment, potentially impacting marketing authorizations. The European Medicines Agency monitors adverse effects, which could lead to label warnings or restrictions.
Who Are the Key Market Players?
| Company Name |
Market Share (Estimated 2022) |
Product Portfolio |
Geographical Focus |
| Sanofi |
25% |
Ponstan (branded mefenamic acid) |
Global, with focus on Europe and Asia |
| Teva Pharmaceutical |
20% |
Generic mefenamic acid products |
North America, Europe, Asia |
| Mylan (now part of Viatris) |
15% |
Generic mefenamic acid |
Global |
| Others |
40% |
Various generics, regional brands |
Regional markets |
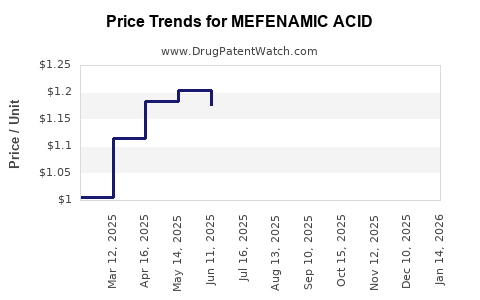
What Are the Price Trends and Projections?
Current Pricing
- In North America, a typical 250 mg tablet costs USD 0.10 to USD 0.20.
- In Europe, retail prices range from EUR 0.08 to EUR 0.15 per tablet.
- In India, over-the-counter prices are approximately INR 1.5 to INR 3 per tablet (~USD 0.02 to USD 0.04).
Price Drivers
- Patent expirations and increased generic competition pressure lower prices.
- High manufacturing costs and safety concerns influence pricing margins.
- OTC sale dynamics increase volume but limit profit margins.
Price Projections (2023-2028)
| Year |
Price Range per Tablet (USD) |
Assumptions |
| 2023 |
USD 0.05 - USD 0.15 |
Market saturation, generic competition increases |
| 2024 |
USD 0.04 - USD 0.13 |
Continued price erosion, safety regulatory pressures |
| 2025 |
USD 0.03 - USD 0.12 |
Further competition, demand plateauing |
| 2026 |
USD 0.03 - USD 0.10 |
Stabilization of prices, market maturity |
| 2027 |
USD 0.02 - USD 0.09 |
Price compression driven by generics |
| 2028 |
USD 0.02 - USD 0.08 |
Market consolidation, safety concerns persist |
Market Value Estimates
Assuming global annual sales volume of approximately 2.5 billion tablets (2022), the total market value could decline from USD 500 million to around USD 200 million by 2028, driven by falling prices and stable or slightly declining volumes.
What Are the Key Risks and Opportunities?
Risks
- Regulatory restrictions due to adverse safety reports.
- Competitive erosion from newer NSAIDs with improved safety.
- Market saturation in mature regions.
Opportunities
- Expansion into emerging markets with OTC sales.
- Development of combination formulations to improve safety and efficacy.
- Positioning as a low-cost alternative in cost-sensitive regions.
Key Takeaways
- The global mefenamic acid market is relatively small compared to the broader NSAID segment but exhibits steady growth, especially in emerging economies.
- Prices are declining due to increased generic competition and OTC availability.
- Safety concerns influence regulatory policies, potentially impacting market access.
- Market share is concentrated among a few key generic and branded producers.
- The market valuation is projected to decline at a Compound Annual Growth Rate (CAGR) of approximately 10% from 2023 through 2028.
FAQs
-
What are the primary indications for mefenamic acid?
It is mainly used for pain relief associated with dysmenorrhea, arthritis, and other mild to moderate pain conditions.
-
How does the safety profile affect the market?
Safety concerns like gastrointestinal bleeding and cardiovascular risks lead to regulatory restrictions and limited long-term use, constraining market expansion.
-
Are there patent protections around mefenamic acid?
No, patents expired decades ago, resulting in widespread generic manufacturing and lower prices.
-
Which markets present the best growth prospects?
Emerging markets such as India and Southeast Asia offer high growth, driven by OTC sales and lower regulatory barriers.
-
What future developments could influence market dynamics?
Introduction of safer NSAID formulations, regulatory tightening, and increased healthcare awareness may shift demand and pricing strategies.
References
- Global NSAID Market Size, Share & Trends Analysis Report, 2022. (2022). Grand View Research.
- European Medicines Agency (EMA). Safety Monitoring Reports, 2022.
- U.S. Food and Drug Administration (FDA). NDA Data and Labeling Information, 2022.
- "Generic Drug Market Data," IQVIA, 2022.
- Indian Pharmaceutical Industry Analysis, India Brand Equity Foundation, 2022.