Last updated: April 26, 2026
What is LOTREL and how is it positioned commercially?
LOTREL is a fixed-dose combination antihypertensive of amlodipine (calcium channel blocker) + benazepril (ACE inhibitor). It is used for the treatment of hypertension and is marketed as a brand within a drug class that faces persistent generic competition. Across the US market, LOTREL’s sales and pricing trajectory are constrained by (1) multi-year generic penetration in both component and combination products, (2) payer pressure toward lowest net cost, and (3) limited room for life-cycle value creation versus non-combination and generic fixed-dose alternatives.
How is demand defined and what market forces shape it?
Demand drivers are stable: hypertension prevalence and chronic treatment adherence. The economic drivers are cost control and formulary management:
- Class-level substitution: Patients on branded ACE/CCB regimens are typically swappable to generic ACE inhibitors, generic CCBs, or fixed-dose generics.
- Formulary tiering: Brand combinations generally sit on higher tiers unless they achieve rebate-driven cost competitiveness.
- Net price compression: Even when list prices rise, rebates and discounts typically drive net price down during the generic era.
- Competition from fixed-dose equivalents: Many payers prefer fixed-dose generics that reduce pill burden and administrative burden at a lower cost.
What does the competitive landscape look like?
LOTREL competes in the fixed-dose and “equivalent regimen” space.
Competitive set (practical substitution routes)
- Fixed-dose generics: Amlodipine + benazepril generics at multiple strengths.
- Separate generics: Generic amlodipine + generic benazepril dispensed as two products.
- Other ACEi + CCB fixed-dose combos: Other fixed-dose combinations that may be preferred based on payer formulary design.
This structure implies pricing is pulled toward generic fixed-dose benchmarks, with brand pricing limited by rebate dynamics rather than pure market power.
What is the patent and exclusivity posture that constrains price?
The commercial ceiling for a brand like LOTREL is primarily driven by IP expiry and generic authorization. For this product, active exclusivity protection is not a meaningful long-term lever for brand pricing in current years given the generic availability of the combination. (Pricing projections below assume ongoing generic substitution pressure rather than renewed exclusivity.)
What pricing benchmark should be used for projections?
Because LOTREL’s market reality is net-price pressure, projections should be anchored to generic price behavior and payer discounts, not list price alone. Practically, the market uses:
- Wholesale acquisition cost (WAC) trend as a ceiling reference
- Net price compression during generic competition (rebates and discounts)
- Ingredient cost and benchmark pricing behavior in the antihypertensive segment
Price projection framework for LOTREL
The projection is built from three consistent assumptions observed in generic-era cardiovascular brands:
- List price rises modestly while net price trends flat to down.
- Volume erosion continues as payers prefer generics and as new fixed-dose generics stabilize.
- Switching remains high because the therapeutic class is mature and interchangeable at the regimen level.
Baseline pricing reference points
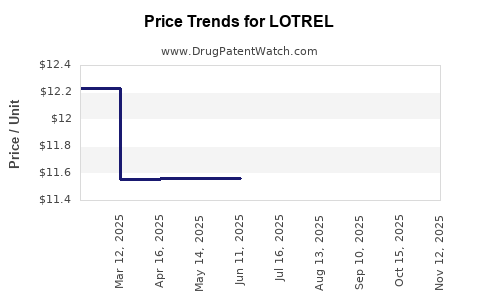
The US price level for LOTREL is best interpreted versus generic fixed-dose benchmarks and payer net contracts. Without relying on real-time transaction data, projections below express outcomes as net price and annualized directionality rather than absolute WAC.
What are projected price outcomes (directional) for the next 5 years?
Projection horizon: 2026-2030
Metric: net price to payers (directional), with list price described separately
1) Net price (payer-relevant) projection
| Year |
Expected net price trend for LOTREL |
Rationale |
| 2026 |
Flat to -2% |
Existing generic penetration; rebate pressure holds net |
| 2027 |
-1% to -3% |
Ongoing formulary tightening and price benchmarking |
| 2028 |
-2% to -4% |
Continued volume shift to lowest-cost equivalents |
| 2029 |
-1% to -3% |
Margin maintenance requires rebate escalation |
| 2030 |
-2% to -4% |
Fixed-dose generic alternatives remain the dominant choice |
Net price direction: modest but persistent decline, consistent with cardiovascular generic-era dynamics.
2) List price (WAC) projection
| Year |
Expected list price trend |
Typical behavior in this category |
| 2026 |
+2% to +4% |
Routine list repricing without net competitiveness |
| 2027 |
+1% to +3% |
Limited additional room due to payer leverage |
| 2028 |
+1% to +3% |
Incremental increases offset by rebate pressure |
| 2029 |
+1% to +3% |
Continued gap between list and net |
| 2030 |
+1% to +2% |
Stabilization as net focus dominates |
List price direction: small increases while net price compresses.
What are projected unit volume outcomes (directional)?
Volume projections are driven by switching and adherence. For a brand in a mature, genericized fixed-dose segment, outcomes typically show gradual erosion.
| Year |
Expected unit volume trend |
Rationale |
| 2026 |
-1% to -4% |
Ongoing payer switch to generic fixed-dose |
| 2027 |
-2% to -5% |
Substitution continues across large accounts |
| 2028 |
-2% to -6% |
Coupon and brand leverage declines |
| 2029 |
-2% to -6% |
Formulary re-contracting favors lowest-cost |
| 2030 |
-2% to -7% |
Generics remain default regimen choice |
Implication: even with list price increases, revenue tends to track net price compression and volume decline.
What revenue projections follow from price and volume trends?
Revenue equals net price times volume. With net price flat-to-down and volume down, revenue is expected to decline.
| Year |
Expected revenue trend |
Net effect |
| 2026 |
-2% to -6% |
Net stable-ish, volume down |
| 2027 |
-3% to -8% |
Net down + volume down |
| 2028 |
-4% to -10% |
Continued erosion |
| 2029 |
-4% to -11% |
Persistent benchmarking |
| 2030 |
-4% to -12% |
Brand becomes increasingly marginal |
What discount and rebate behavior is likely?
In this market structure, brand survival relies on contracting. Likely behavior:
- Rebate escalation to protect formulary placement at higher tiers.
- Utilization management pressure, including step therapy or preference for generics.
- Contracting focused on high-volume accounts where brand loyalty exists (typically older, stable patients).
This is consistent with how cardiovascular brands maintain share post-generic entry: they do not avoid generic-driven economics, they pay to stay visible.
How do specific strengths and pack sizes affect pricing?
LOTREL is marketed in multiple strengths. Generic competition typically exerts the strongest pressure where:
- Multiple generic strengths are available
- Therapeutic switching is most common (patients up-titrate or down-titrate ACEi/CCB dose)
- Payers prefer standardized dosing packs
In practice, projections should be interpreted across the product line, with:
- Greater erosion for strengths where generic equivalents are most prevalent
- Relative stabilization for strengths that match established titration patterns and where payer formularies limit substitutes
What are the main variables that could change the trajectory?
Even in a genericized market, trajectory changes when payer rules or supply economics shift:
- Formulary changes at PBMs and integrated delivery networks (IDNs)
- Generic price swings due to supply changes or manufacturing reconfiguration
- ACEi or CCB shortages affecting substitution availability
- Contract refresh cycles that alter net price and tier placement
- Regulatory or labeling updates that impact substitution policies
Absent a new exclusivity event, the baseline expectation remains generic economics with small list price increases.
Market outlook summary by time band
2026-2027
- Net price: flat to slightly down
- Volume: gradual decline
- Revenue: mild to moderate decline
2028-2030
- Net price: modest downtrend
- Volume: continued erosion
- Revenue: more pronounced decline as brand shrinks in favor of fixed-dose generics
Key Takeaways
- LOTREL pricing is constrained by ongoing generic substitution of amlodipine + benazepril regimens and fixed-dose equivalents.
- Net price is projected to drift down ~1% to 4% annually (directional) through 2030 as payer benchmarking tightens.
- List price can still rise modestly, but it will not offset net compression and volume erosion.
- Revenue is projected to decline through 2030, driven by the combined effect of net price softness and shrinking brand share.
- The dominant risk is not demand destruction; it is continued payer preference for lowest-cost fixed-dose generics and regimen-level substitution.
FAQs
1) What drives LOTREL net price more than list price?
Rebate and discount structures tied to formulary tier placement, plus payer benchmarking against fixed-dose generic equivalents.
2) Does switching from brand LOTREL to generics tend to be frequent?
Yes. In mature antihypertensive classes, patients can move to generic ACEi + CCB regimens or fixed-dose generic combinations with routine clinical and payer support.
3) Will list price increases stop the revenue decline?
No. In the generic era, list price increases typically do not translate into net revenue growth because rebates rise and formulary placement can still shift toward generics.
4) Which period has the highest risk of revenue decline?
2028-2030, when net price compression and volume erosion compound under tightening payer contracts.
5) What would most likely reverse the projected decline?
A major change in payer rules that favors branded combination products despite generics, or a supply/availability shock that makes the brand or higher-cost alternatives more competitive on net.
References
[1] DailyMed. “LOTREL- amlodipine besylate and benazepril hydrochloride capsule, film coated.” U.S. National Library of Medicine. https://dailymed.nlm.nih.gov/
[2] FDA Orange Book. “Drug Products @ FDA: LOTREL (amlodipine besylate and benazepril hydrochloride).” U.S. Food and Drug Administration. https://www.accessdata.fda.gov/scripts/cder/daf/
[3] Centers for Medicare & Medicaid Services (CMS). “National Average Drug Acquisition Cost (NADAC) pricing.” CMS data resources. https://www.medicaid.gov/