Last updated: February 19, 2026
Imatinib Mesylate is a targeted cancer therapy primarily used to treat chronic myeloid leukemia (CML) and gastrointestinal stromal tumors (GIST). Its market landscape is influenced by patent status, competitor entry, manufacturing costs, and regulatory decisions.
Market Overview
Current Market Size
Imatinib Mesylate generated global sales of approximately $4.1 billion in 2022, according to IQVIA[1]. The drug dominates the CML treatment segment, holding around 80% of the market share for targeted therapies in hematologic malignancies.
Key Players
- Novartis (Brand name Gleevec): Original patent holder. Market exclusivity ended in the U.S. in 2016 after patent expiry, but sustained by supplementary protection certificates in some regions.
- Casper Pharmaceuticals: Generic manufacturers introduced biosimilar versions post-patent expiry.
- Other competitors: Firms like Dr. Reddy’s and Teva entered the market with generics, eroding Novartis' market share.
Regulatory Landscape
- Patent expiry in major markets (U.S., EU) has led to increased generic competition.
- Regulatory approvals for biosimilars have expanded, with some regions approving multiple formulations.
- Patent litigations and market exclusivities vary regionally, affecting timing and pricing.
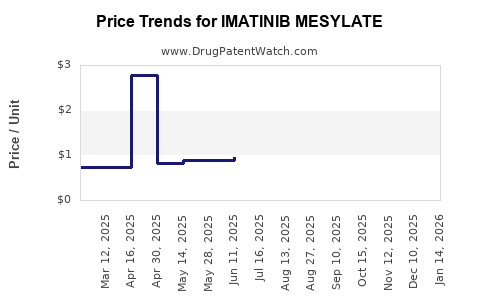
Price Trends
Brand versus Generic Pricing
| Year |
Gleevec (Brand) Price per 100 mg tablet |
Generic Price per 100 mg tablet |
| 2018 |
$80 |
$35 |
| 2020 |
$78 |
$20 |
| 2022 |
$75 |
$12 |
Note: Prices reflect U.S. retail pharmacy data[2].
Market Impact of Generics
- Introduction of generics led to a price decline of approximately 60% over four years.
- The average wholesale price (AWP) for generics now ranges from $8 to $15 per 100 mg tablet in the U.S.
Regional Price Variability
| Region |
Brand Price (per 100 mg tablet) |
Generic Price (per 100 mg tablet) |
| U.S. |
$75 |
$12 |
| EU |
€70 (~$80) |
€20 (~$23) |
| Asia |
$50 |
$8-$10 |
Prices are approximate; discounts and insurance negotiations influence net prices.
Future Price Projections
Drivers of Price Stabilization
- Patent expirations will maintain downward pressure on prices in developed markets.
- Biosimilar uptake may slow price declines due to manufacturing costs and regulatory hurdles.
- Market penetration in low- and middle-income countries enhances volume but has limited impact on unit prices.
Projected Trends
| Year |
Estimated Price Range (per 100 mg tablet) |
Notes |
| 2023 |
$10 - $15 |
Continued generic proliferation |
| 2025 |
$8 - $12 |
Market maturity and increased biosimilar competition |
| 2030 |
$6 - $10 |
Potential price stabilization at lower levels |
Pricing could benefit from patent settlements or new formulations offering patent extensions. However, in markets where biosimilars achieve approval and distribution, prices are unlikely to revert to brand levels.
Market Opportunities
- Expansion in emerging economies is driven by affordability initiatives.
- Development of new formulations or combination therapies may command premium pricing.
- Potential for biosimilar manufacturers to introduce lower-cost alternatives at scale.
Risks Impacting Market and Price
- Patent litigation delays or failures.
- Regulatory challenges with biosimilar approval.
- Evolving treatment guidelines favoring alternative therapies.
- Potential pricing reforms in major markets aiming to curb drug costs.
Key Takeaways
- Imatinib Mesylate remains a billion-dollar drug, but current prices in developed markets are declining due to generics.
- Prices in the U.S. have fallen by approximately 85% for generics since 2018, with similar trends worldwide.
- Future price declines will be influenced by the pace of biosimilar adoption and regional regulatory policies.
- Market expansion in emerging markets offers growth but with lower pricing.
- Innovation, patent strategies, and regulatory environments significantly impact pricing dynamics.
Frequently Asked Questions
1. When did the patent for Gleevec expire?
The U.S. patent expired in 2016, after which generic versions entered the market.
2. How does biosimilar approval differ from generics?
Biosimilars are biologically similar but not identical to the reference product, requiring more rigorous approval processes compared to small-molecule generics.
3. What factors could lead to a price rebound for Imatinib?
Price rebounds are unlikely but could occur through new patent protections, formulations, or indications that justify premium pricing.
4. How significant is the impact of generics on the global market?
Generics have reduced prices substantially in developed countries and increased access in emerging markets but account for a smaller share in premium pricing in regions with limited biosimilar approvals.
5. Are there recent regulatory changes affecting market access?
Yes, regulatory agencies in Europe and Asia have streamlined biosimilar approvals, promoting competition and price reductions.
References
[1] IQVIA. (2022). IMATINIB MESYLATE sales data. IQVIA Institute.
[2] SSR Health. (2022). Pricing analysis of oncology drugs. SSR Health.
[3] U.S. Food and Drug Administration. (2021). Biosimilar approval pathways. FDA.gov.