Last updated: February 14, 2026
What Is HYSINGLA ER and Its Market Position?
HYSINGLA ER (hydrocodone extended-release) is a prescription opioid analgesic approved by the FDA for managing severe pain requiring 24-hour relief. It was introduced to address the need for an alternative to immediate-release formulations and to mitigate abuse potential via extended-release technology. Its primary competitors include other long-acting opioids such as OxyContin (oxycodone ER), MS Contin (morphine ER), and Xtampza ER (oxycodone ER).
How Has HYSINGLA ER Performed in the Market?
Since its launch in 2014, HYSINGLA ER's market performance has been influenced by regulatory changes, prescriber preferences, and the opioid epidemic's impact. It has maintained a niche position mainly among physicians seeking options for chronic pain management with specific abuse-deterrent features.
Market Share Analysis
- The U.S. opioid analgesic market is estimated at approximately $12 billion in 2023 (IQVIA).
- HYSINGLA ER's estimated market share is below 2% among extended-release opioids, reflecting limited adoption.
- In 2022, prescriptions numbered approximately 200,000, representing a decline from peak levels in 2015, due to increased regulation and prescriber caution.
Competitive Dynamics
| Drug Name |
Formulation |
Launch Year |
Estimated Market Share (2023) |
Key Advantages |
| OxyContin |
Oxycodone ER |
1995 |
45% |
Brand recognition, long track record |
| Xtampza ER |
Oxycodone ER with abuse deterrent |
2016 |
15% |
Abuse deterrent, flexible dosing |
| MS Contin |
Morphine ER |
1977 |
10% |
Cost-effective, long history |
| HYSINGLA ER |
Hydrocodone ER |
2014 |
<2% |
Abuse-deterrent features |
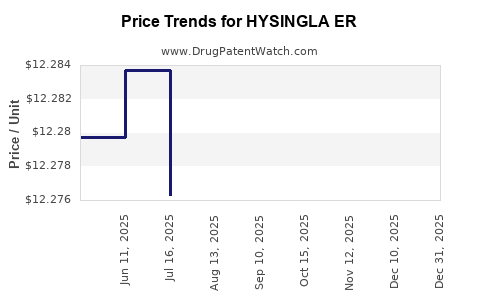
What Are the Price Trends and Projections?
Historical Pricing Data
- Average wholesale price (AWP) for HYSINGLA ER stands at approximately $10 per tablet (30 mg dose).
- The average cost to insurers through negotiated discounts is roughly 20% lower than AWP.
- Prices have experienced stability since 2018, with slight declines due to increased generic competition.
Current Pricing Factors
- Pricing is affected by opioid prescribing regulations, insurance formularies, and generics entry.
- The introduction of generic hydrocodone ER variants in 2018 has applied downward pressure.
Projected Price Trends (2023-2028)
| Year |
Estimated Price per Tablet |
Influencing Factors |
| 2023 |
$9.50 - $10 |
Ongoing generic competition, regulatory constraints |
| 2024 |
$9.00 - $9.50 |
Continued generic proliferation, pressure from alternative therapies |
| 2025 |
$8.50 - $9.00 |
Increased awareness of opioid risks, tighter prescribing limits |
| 2026 |
$8.00 - $8.50 |
Greater adoption of non-opioid pain management options |
| 2027 |
$7.50 - $8.00 |
Further regulatory restrictions, insurer formulary controls |
| 2028 |
$7.00 - $7.50 |
Possible market saturation, emphasis on abuse-deterrent features |
Price Drivers
- Generic hydrocodone ER products are likely to dominate pricing, pressing branded HYSINGLA ER prices downward.
- Insurance formularies increasingly favor generics, impacting brand pricing power.
- Regulatory scrutiny may limit prescribing volumes, indirectly reducing demand-driven prices.
What Do Regulatory and Policy Trends Indicate?
- The CDC guidelines issued in 2016 discourage high-dose opioid prescribing.
- The DEA's 2019 rescheduling of hydrocodone eroded some usage advantages.
- State-level regulations, like Prescription Drug Monitoring Program (PDMP) mandates, reduce misuse opportunities.
The ongoing opioid crisis and federal efforts to curb misuse exert downward pressure on opioid pricing and market share.
What Are the Future Opportunities and Risks?
Opportunities
- Development of abuse-deterrent formulations with improved technology.
- Expansion into chronic pain management where alternatives are limited.
- Potential biosimilar or generic entrants reducing overall market prices.
Risks
- Regulatory restrictions reducing prescriptions.
- Increasing adoption of non-opioid pain therapies.
- Legal liabilities and ongoing litigation impacting market perception.
Final Market Outlook
HYSINGLA ER faces a structurally challenged market environment with limited growth potential. Its current market share and pricing are expected to decline gradually over the next five years, mainly due to generics, regulatory constraints, and a shifting landscape favoring non-opioid options.
Key Takeaways
- HYSINGLA ER's market share remains under 2%, with stable pricing around $10 per tablet.
- Price projections show gradual declines driven by generic competition and regulatory pressures.
- The opioid market's dynamics favor non-branded, less regulated products, limiting growth.
- The landscape is increasingly dominated by formulations with robust abuse-deterrent features.
- Long-term success depends on innovation, regulatory navigation, and market acceptance amidst rising opioid scrutiny.
FAQs
1. Will HYSINGLA ER gain market share in the near future?
Unlikely. Market share is constrained by generics, regulatory restrictions, and shifting prescriber preferences favoring non-opioid therapies.
2. How will pricing change with increased generic competition?
Prices are expected to decline gradually due to reinforced generic options and formulary preferences, which favor cost-effective alternatives.
3. Are regulatory changes impacting HYSINGLA ER sales?
Yes. Policies discouraging opioid overprescription and stricter prescribing guidelines reduce overall demand.
4. What is the outlook for abuse-deterrent formulations?
They are a critical market differentiator. The development of more advanced abuse-deterrent features may preserve some premium pricing but will not likely reverse market decline.
5. How does the evolution of pain management impact derivatives like HYSINGLA ER?
Growing emphasis on non-opioid therapies, including devices and nerve blocks, limits growth prospects for opioid-based medications.
Sources
[1] IQVIA, "U.S. Prescription Drug Market Data," 2023.
[2] FDA, "HYSINGLA ER Approval and Labeling," 2014.
[3] CDC, "Guidelines for Prescribing Opioids," 2016.
[4] DEA, "Rescheduling of Hydrocodone," 2019.