Share This Page
Drug Price Trends for HYDROQUINONE
✉ Email this page to a colleague
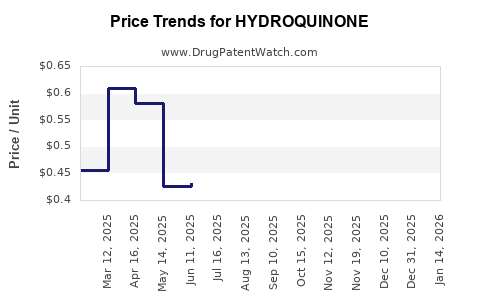
Average Pharmacy Cost for HYDROQUINONE
| Drug Name | NDC | Price/Unit ($) | Unit | Date |
|---|---|---|---|---|
| HYDROQUINONE 4% CREAM | 42192-0151-01 | 0.55017 | GM | 2026-06-17 |
| HYDROQUINONE 4% CREAM | 69367-0174-01 | 0.55017 | GM | 2026-06-17 |
| HYDROQUINONE 4% CREAM | 75834-0137-01 | 0.44450 | GM | 2026-06-17 |
| HYDROQUINONE 4% CREAM | 42192-0151-01 | 0.54609 | GM | 2026-05-20 |
| >Drug Name | >NDC | >Price/Unit ($) | >Unit | >Date |
Hydroquinone: Market Dynamics and Price Forecast
Hydroquinone is a depigmenting agent used in the cosmetic and pharmaceutical industries. Its primary application is for the treatment of hyperpigmentation disorders such as melasma, lentigines, and post-inflammatory hyperpigmentation. The global market for hydroquinone is influenced by the prevalence of these conditions, consumer demand for skin lightening products, and regulatory landscapes in key regions. Price projections are sensitive to raw material costs, manufacturing capacity, and competitive pressures.
What is the Current Global Market Size for Hydroquinone?
The global hydroquinone market was valued at approximately $230 million in 2023. The market is projected to grow at a compound annual growth rate (CAGR) of 4.2% from 2024 to 2030. This growth is driven by an increasing awareness of dermatological conditions and a rising demand for cosmetic treatments addressing uneven skin tone.
- Regional Distribution: North America and Europe represent mature markets with established regulatory frameworks and a strong consumer base for dermatological products. The Asia-Pacific region is experiencing rapid growth due to increasing disposable incomes, a cultural preference for lighter skin tones, and the expansion of the beauty and personal care industry.
- Application Segmentation:
- Cosmetic Use: Accounts for an estimated 70% of the hydroquinone market, primarily for skin lightening creams, serums, and lotions.
- Pharmaceutical Use: Constitutes approximately 30% of the market, used in prescription topical treatments for specific dermatological conditions under medical supervision.
What are the Key Drivers of Hydroquinone Market Growth?
Several factors contribute to the sustained demand and expansion of the hydroquinone market:
- Rising Prevalence of Hyperpigmentation Disorders: Conditions like melasma, which affect millions globally, are primary drivers. A study by the American Academy of Dermatology indicated that melasma affects up to 50% of pregnant women and a significant percentage of women in reproductive years [1]. The increase in awareness and diagnosis of these conditions directly translates to higher demand for effective treatments like hydroquinone.
- Growing Demand for Skin Lightening Products: The global trend towards lighter skin tones, particularly prominent in Asia, Latin America, and parts of Africa, fuels the demand for cosmetic products containing hydroquinone. The beauty industry's expansion, coupled with increased social media influence showcasing ideal skin appearances, reinforces this demand.
- Technological Advancements in Formulations: Pharmaceutical and cosmetic companies are investing in research and development to create more effective and safer hydroquinone formulations. This includes developing controlled-release mechanisms and combination therapies to enhance efficacy and mitigate potential side effects, thereby broadening market appeal.
- Aging Population and Age Spots: As the global population ages, the incidence of age spots (solar lentigines) increases. Hydroquinone remains a well-established and cost-effective treatment for these common dermatological concerns, contributing to steady demand.
- Increasing Disposable Income in Emerging Economies: In countries like China, India, and Brazil, rising disposable incomes allow a larger segment of the population to access cosmetic procedures and premium skincare products, including those containing hydroquinone.
What are the Restraints Affecting the Hydroquinone Market?
Despite its growth potential, the hydroquinone market faces several significant challenges:
- Regulatory Scrutiny and Bans: Hydroquinone has faced significant regulatory challenges in various regions due to safety concerns.
- European Union: Hydroquinone is banned in over-the-counter (OTC) cosmetic products in the EU, with its use restricted to prescription-only medicines at concentrations up to 2% and for specific indications [2]. This severely limits its OTC market in a major economic bloc.
- United States: The U.S. Food and Drug Administration (FDA) has proposed to make hydroquinone an OTC drug, but this process has been lengthy and complex. Currently, it is available OTC at concentrations up to 2% but remains under scrutiny for safety and efficacy [3]. Some sources indicate a potential reclassification to prescription-only status.
- Other Regions: Several other countries have similar restrictions or outright bans on hydroquinone in cosmetics.
- Adverse Side Effects: Potential side effects of hydroquinone include skin irritation, redness, dryness, and, in rare cases, ochronosis (a darkening and thickening of the skin) with prolonged or high-concentration use [4]. These concerns lead to consumer apprehension and a preference for alternative treatments.
- Availability of Alternative Treatments: The market has seen a rise in alternative depigmenting agents and treatments. These include:
- Kojic Acid: Derived from fungi, it is a popular alternative in many cosmetic formulations.
- Vitamin C (Ascorbic Acid): A well-known antioxidant that also inhibits melanin production.
- Azelaic Acid: Effective for hyperpigmentation and acne.
- Alpha Hydroxy Acids (AHAs) and Beta Hydroxy Acids (BHAs): Used for exfoliation to improve skin tone.
- Laser Therapy and Chemical Peels: Professional dermatological procedures offer alternatives for more severe pigmentation issues.
- Ethical and Social Concerns: In some cultures, the use of skin lightening agents is associated with historical contexts of colorism and racial discrimination. While hydroquinone is a chemical compound, its widespread use for lightening has drawn criticism from an ethical standpoint, potentially impacting its market acceptance.
- Raw Material Price Volatility: The production of hydroquinone relies on precursor chemicals, the prices of which can fluctuate due to global supply chain issues, geopolitical events, and manufacturing costs. These fluctuations can impact the final product cost and profit margins for manufacturers.
What are the Key Product Segments and Their Price Trends?
The hydroquinone market can be segmented by product form and concentration, influencing pricing.
Product Form:
- Creams and Lotions: These are the most common forms for both cosmetic and pharmaceutical applications.
- Price Range (Cosmetic Grade, 2%): $15 - $40 for a 30g product.
- Price Range (Pharmaceutical Grade, 4% Prescription): $50 - $150 for a 30g product, depending on the brand and prescription.
- Serums: Typically higher concentrations or formulations with additional active ingredients, often commanding a premium.
- Price Range (Cosmetic Grade, 2-4%): $25 - $70 for a 30ml serum.
- Powder: Used as a raw ingredient in manufacturing.
- Price Range (Technical Grade): $5 - $15 per kilogram, subject to bulk order discounts.
Concentration:
- Up to 2%: Commonly found in OTC cosmetic products in regions where permitted. Pricing is generally lower due to wider availability and less stringent regulation.
- 4% and above: Typically found in prescription-strength pharmaceutical products for medical treatment of hyperpigmentation. These command higher prices due to their classification as drugs and the need for medical oversight.
- Higher Concentrations (>10%): Rarely used in direct-to-consumer products due to significant safety concerns. If used, it is in highly controlled industrial or research settings.
What are the Price Projections for Hydroquinone?
Price projections for hydroquinone are subject to several variables, including regulatory changes, raw material costs, and competitive dynamics.
- Short-Term (1-2 years): Prices are expected to remain stable to slightly increasing.
- Cosmetic Grade (2%): Anticipated to see a 2-3% annual increase, primarily driven by rising manufacturing and marketing costs, and potential supply chain adjustments.
- Pharmaceutical Grade (4%+): May see a 3-5% annual increase due to stricter quality control requirements, R&D investment in new formulations, and the higher value placed on prescription products.
- Medium-Term (3-5 years): Price trends will be significantly influenced by regulatory decisions.
- If hydroquinone's regulatory status in key markets like the US becomes more restrictive (e.g., prescription-only), pharmaceutical-grade products will likely see sustained price increases (4-6% annually) due to reduced competition and increased R&D costs. Cosmetic-grade prices might stabilize or even decrease in markets where it is restricted, as manufacturers shift focus to alternatives.
- If regulations remain stable or slightly ease for OTC use, prices could follow a moderate upward trend (3-4% annually), influenced by inflation and raw material costs.
- Long-Term (5-10 years): The market will likely bifurcate further.
- The cosmetic segment will increasingly rely on hydroquinone alternatives, potentially leading to a decline in hydroquinone's market share and price pressure in this segment.
- The pharmaceutical segment will continue to value hydroquinone for specific, well-defined medical uses. Prices for prescription formulations are expected to rise steadily (4-7% annually), driven by innovation in delivery systems, combination therapies, and the ongoing costs associated with clinical validation and regulatory compliance.
Factors influencing price changes:
- Raw Material Costs: The price of benzene, a key precursor, and other chemicals involved in hydroquinone synthesis can fluctuate. A sustained increase in benzene prices will directly impact hydroquinone manufacturing costs.
- Manufacturing Capacity: Overcapacity can lead to price competition, while undercapacity can drive prices up. Shifts in global manufacturing hubs, particularly from China and India, could influence supply and pricing.
- Regulatory Landscape: This is the most significant variable. Stricter regulations or outright bans in major markets will suppress prices for cosmetic applications and potentially increase them for restricted pharmaceutical uses. Conversely, regulatory clarity and approval for new indications could boost demand and prices.
- Competition from Alternatives: The development and adoption of effective and safer alternatives will continue to exert downward pressure on hydroquinone prices, particularly in the cosmetic sector.
What are the Key Regional Market Dynamics?
| Region | Market Status | Key Drivers | Key Restraints | Price Trend Projection (5-Year Avg. CAGR) |
|---|---|---|---|---|
| North America | Mature market. Strong demand for both cosmetic and pharmaceutical applications. High consumer awareness of skincare. | High prevalence of hyperpigmentation, aging population, demand for anti-aging products, strong R&D in pharmaceuticals. | Ongoing FDA scrutiny, potential reclassification to prescription-only, competition from alternatives, consumer preference for "clean beauty" products. | 3.0% - 4.0% |
| Europe | Heavily regulated market. Primarily pharmaceutical use; cosmetic use is largely banned OTC. | Established dermatological care infrastructure, demand for prescription treatments for melasma and post-inflammatory hyperpigmentation. | EU ban on OTC hydroquinone, stringent regulatory approval processes, increasing consumer demand for natural alternatives. | 2.0% - 3.0% |
| Asia Pacific | Fastest-growing market. Significant demand for skin lightening and cosmetic products. | High demand for skin lightening due to cultural preferences, rising disposable incomes, expansion of e-commerce and beauty brands, increasing awareness of dermatological issues. | Varying regulatory frameworks across countries (some with stricter controls, others more lenient), concerns over product safety and quality in some sub-regions, growing availability of diverse cosmetic ingredients. | 4.5% - 5.5% |
| Latin America | Growing market. Demand driven by cosmetic applications and treatment of hyperpigmentation. | Increasing adoption of skincare routines, influence of global beauty trends, prevalence of melasma and sun-induced pigmentation. | Economic volatility impacting consumer spending, varying regulatory enforcement, competition from imported products. | 3.5% - 4.5% |
| Middle East & Africa | Emerging market. Demand for skin lightening and cosmetic products is growing, particularly in urban centers. | Increasing disposable incomes, influence of global beauty standards, prevalence of hyperpigmentation due to sun exposure. | Limited access to advanced dermatological treatments in some areas, inconsistent regulatory oversight, preference for traditional remedies alongside modern treatments. | 4.0% - 5.0% |
Who are the Key Market Players?
The hydroquinone market is moderately fragmented. Key players include:
- Symrise AG: A major supplier of cosmetic ingredients, including hydroquinone derivatives.
- Dow Chemical Company: A significant producer of chemical intermediates, including hydroquinone for industrial and pharmaceutical use.
- Merck KGaA: Offers hydroquinone for research and laboratory applications.
- Vigon International, Inc.: Supplies specialty chemicals, including hydroquinone, to various industries.
- Anmol Chemicals Group: An Indian-based manufacturer and exporter of hydroquinone and other chemicals.
- KAO Corporation: While not a primary hydroquinone manufacturer, KAO is a major player in the cosmetic industry and utilizes various depigmenting agents, influencing market demand.
- L'Oréal S.A.: A global leader in cosmetics that formulates products with depigmenting agents, though increasingly exploring alternatives to hydroquinone in regions with restrictions.
- Obagi Cosmeceuticals: Known for its prescription skincare lines that have historically included hydroquinone.
Key Takeaways
The global hydroquinone market is projected to grow at a CAGR of 4.2% through 2030, driven by the rising prevalence of hyperpigmentation disorders and demand for skin lightening products. However, the market faces significant restraints from stringent regulatory scrutiny and bans in key regions, particularly in Europe for cosmetic use, and potential future restrictions in the US. Safety concerns and the increasing availability of alternative depigmenting agents also challenge market expansion.
Price projections indicate a stable to moderate increase in the short to medium term, with pharmaceutical-grade products expected to see higher annual price growth than cosmetic-grade. Long-term price trends will be heavily dictated by regulatory outcomes and the successful adoption of alternative ingredients and treatments. The Asia-Pacific region is expected to lead market growth, while North America and Europe represent mature but complex markets due to regulatory environments. The market is characterized by a mix of large chemical manufacturers and specialized cosmetic ingredient suppliers.
Frequently Asked Questions
-
Will hydroquinone be banned in the United States for cosmetic use? The U.S. FDA has been reviewing hydroquinone's status for OTC use for years. While no definitive ban has been enacted, the process has been complex, and there remains a possibility of reclassification to prescription-only status, similar to regulatory actions in other major markets.
-
What are the most effective alternatives to hydroquinone for hyperpigmentation? Effective alternatives include azelaic acid, kojic acid, tranexamic acid, niacinamide, vitamin C (ascorbic acid), and alpha hydroxy acids (AHAs) like glycolic acid. Professional treatments such as chemical peels and laser therapy are also widely used.
-
How does regulatory status impact the price of hydroquinone globally? Regions with strict regulations, such as the EU's ban on OTC hydroquinone in cosmetics, lead to lower volumes and potentially lower prices for cosmetic-grade hydroquinone in those specific markets, while driving demand and potentially higher prices for regulated pharmaceutical-grade products. Conversely, regions with more lenient regulations may see higher demand for cosmetic hydroquinone, influencing its price based on supply and demand.
-
What is the primary raw material for hydroquinone production, and how does its price affect hydroquinone costs? Benzene is a primary raw material for hydroquinone production. Fluctuations in benzene prices, influenced by crude oil costs and petrochemical market dynamics, directly impact the manufacturing cost of hydroquinone, leading to corresponding adjustments in its market price.
-
Is hydroquinone safe for long-term use? The safety of hydroquinone depends on its concentration, duration of use, and individual skin type. While effective for short-term treatment of hyperpigmentation under medical supervision, prolonged use of higher concentrations can lead to side effects such as skin irritation and ochronosis. Regulatory bodies worldwide have established concentration limits and usage guidelines to mitigate these risks.
Citations
[1] American Academy of Dermatology Association. (n.d.). Melasma. Retrieved from https://www.aad.org/public/diseases/a-z/melasma
[2] European Commission. (2000). Regulation (EC) No 1223/2009 of the European Parliament and of the Council of 30 November 2009 on cosmetic products. Official Journal of the European Union.
[3] U.S. Food & Drug Administration. (2020, February 6). FDA proposes to make hydroquinone an over-the-counter (OTC) drug. Retrieved from https://www.fda.gov/news-events/press-announcements/fda-proposes-make-hydroquinone-over-counter-otc-drug
[4] Griffith, B. H. (1972). Hydroquinone. Archives of Dermatology, 105(2), 241–242. doi:10.1001/archderm.1972.01600080081020
More… ↓
