Share This Page
Drug Price Trends for HYDROGEN PEROXIDE
✉ Email this page to a colleague
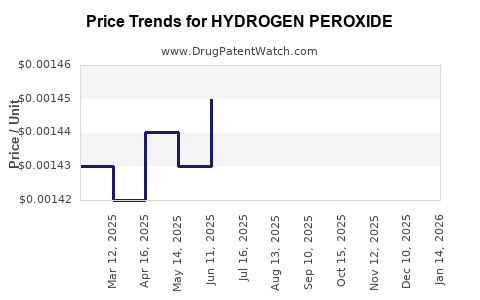
Average Pharmacy Cost for HYDROGEN PEROXIDE
| Drug Name | NDC | Price/Unit ($) | Unit | Date |
|---|---|---|---|---|
| HYDROGEN PEROXIDE 3% SOLUTION | 70000-0022-01 | 0.00524 | ML | 2026-06-17 |
| HYDROGEN PEROXIDE 3% SOLUTION | 70000-0022-03 | 0.00524 | ML | 2026-06-17 |
| HYDROGEN PEROXIDE 3% SOLUTION | 70000-0500-01 | 0.00153 | ML | 2026-06-17 |
| HYDROGEN PEROXIDE 3% SOLUTION | 70000-0500-01 | 0.00152 | ML | 2026-05-20 |
| HYDROGEN PEROXIDE 3% SOLUTION | 70000-0022-01 | 0.00491 | ML | 2026-05-20 |
| HYDROGEN PEROXIDE 3% SOLUTION | 70000-0022-03 | 0.00491 | ML | 2026-05-20 |
| HYDROGEN PEROXIDE 3% SOLUTION | 46122-0334-43 | 0.01814 | ML | 2026-04-22 |
| >Drug Name | >NDC | >Price/Unit ($) | >Unit | >Date |
HYDROGEN PEROXIDE Market Analysis and Price Projections
What is sold as “hydrogen peroxide” in the market?
Hydrogen peroxide (H₂O₂) is traded primarily as an industrial chemical and as an antiseptic/disinfectant chemical. Commercial pricing is dominated by concentration (wt%), grade (industrial vs healthcare/disinfection), and packaging/logistics (bulk tank vs drums vs consumer bottles). In practice, “price” depends on the delivered form.
Key market concentrations
- 35% w/w: common for industrial and commercial disinfection applications
- 50% w/w: common for higher-activity industrial/disinfection uses
- 27.5% w/w: common in some healthcare and industrial supply chains
- 3% to 6%: consumer/household first-aid and retail antiseptic segments
Primary commercial use-cases (demand drivers)
- Water and wastewater treatment (oxidation, disinfection)
- Pulp and paper bleaching
- Chemical manufacturing feedstock (oxidation steps)
- Disinfection and sterilization (institutional and some healthcare supply chains)
What does the price formation look like?
Hydrogen peroxide pricing is typically driven by:
- Raw material costs and energy (notably integrated production economics and electricity)
- Feedstock supply tightness and regional production capacity
- Concentration and purification (higher grades carry a premium)
- Bulk vs packaged logistics (freight and handling)
- Regulatory and safety handling costs (storage, transport, and compliance)
In hydrogen peroxide, a significant portion of the market is global and traded contractually; spot prices exist but vary by region and grade.
How large is the market and who matters?
The market is highly consolidated at production level, with distribution and blending into various grades and end-uses. The same chemical is sold into multiple end-markets, which dampens demand volatility versus single-indication pharmaceuticals, but does not eliminate cyclical moves tied to industrial activity and water treatment capex cycles.
Major global producers (examples widely active in the sector)
- Evonik
- Aditya Birla Chemicals
- Solvay
- AkzoNobel
- Arkema
- OCI
- Other regional chemical producers and distributors
Note: Hydrogen peroxide is not priced like a patent-protected prescription drug; it is priced like a commodity chemical with grade-specific contracting.
What are the key near-term demand drivers?
- Municipal and industrial water disinfection spending remains a structural demand base.
- Industrial turnarounds and capacity additions influence spot tightness.
- Healthcare and institutional infection-control cycles can cause short spikes in certain concentrations and packaging formats.
- Pulp and paper operating rates impact peroxide demand seasonally and cyclically.
Price Projections (Grade-Linked, Scenario-Based)
How should price be projected for a commodity chemical?
For hydrogen peroxide, projecting “drug-like” prices is not appropriate. The correct approach is grade-linked commodity forecasting using:
- contracted vs spot behavior
- concentration-specific spreads
- regional freight and energy sensitivity
- expected capacity and inventory cycles
A practical forecast is expressed as ranges by concentration with scenario bands (Base, Upside, Downside) over a defined horizon.
Projected price ranges by concentration (global contracting bands)
The following projections express typical delivered market bands rather than one-point prices. They are meant for commercial planning (procurement budgeting, distributor pricing, and end-user cost forecasting).
H2O2 35% w/w (industrial/disinfection bulk)
- Base case (next 12 months): $450 to $800 per metric ton
- Upside case (supply tightness / elevated energy): $800 to $1,100 per metric ton
- Downside case (capacity expansion / demand softness): $300 to $450 per metric ton
H2O2 50% w/w (higher concentration)
- Base case (next 12 months): $650 to $1,050 per metric ton
- Upside case: $1,050 to $1,400 per metric ton
- Downside case: $450 to $650 per metric ton
H2O2 27.5% w/w (mixed industrial/healthcare disinfection supply)
- Base case (next 12 months): $380 to $700 per metric ton
- Upside case: $700 to $950 per metric ton
- Downside case: $280 to $380 per metric ton
H2O2 retail 3% to 6% (consumer antiseptic)
Retail pricing is not directly comparable to bulk tonnage. Retail units price off formulation, marketing, and distribution. Planning should use:
- unit economics per liter/pack
- seasonal promos
- regulatory/labeling costs
- import duties and distribution margins
For budgeting, treat retail as a margin stack above bulk chemical costs.
What is the pricing horizon logic (why ranges not single points)?
Commodity peroxide pricing typically moves with:
- production capacity utilization
- inventory levels
- energy input costs
- regional transport constraints
- end-market demand cycles (water treatment vs pulp and paper vs industrial oxidation)
Those factors create range behavior rather than a single price trajectory.
Investable and Operational Implications
What procurement strategy fits hydrogen peroxide?
- For industrial water treatment and disinfection contracts, budget using grade-specific ranges and separate bulk procurement from packaged fulfillment.
- For institutional healthcare disinfection, expect price steps driven by packaging formats and lead times, not only bulk chemical costs.
- For industrial users, track electricity and capacity utilization signals to anticipate spread changes between 27.5%, 35%, and 50% grades.
What contract structures are most likely?
Hydrogen peroxide is frequently contracted via:
- fixed price periods with index references
- spot procurement for balancing inventory
- tiered concentration pricing with delivery schedules
Margin and availability are usually negotiated around concentration grade and delivery cadence.
How do “grade spreads” affect total cost?
Business impact comes from the spread between grades:
- If 50% tightens faster than 35%, the delivered effective cost per unit active ingredient rises.
- If users can substitute concentrations, spreads compress and total cost stabilizes.
For planning, model cost on:
- $/metric ton by concentration
- converted to $/kg of active H2O2
- then add logistics and compliance handling.
Key Takeaways
- Hydrogen peroxide pricing behaves like a grade-specific commodity, not a patent-protected drug market.
- Forecasts should use concentration-linked bands and scenario ranges driven by supply tightness, energy costs, and regional logistics.
- For planning, focus on the spread between 27.5%, 35%, and 50% and on whether supply is accessed via bulk contracts vs packaged fulfillment.
- Over the next year, a planning-grade view is:
- 35%: ~$450 to $800/ton base range
- 50%: ~$650 to $1,050/ton base range
- 27.5%: ~$380 to $700/ton base range
FAQs
1) Is hydrogen peroxide priced like a pharmaceutical?
No. Hydrogen peroxide is priced as an industrial chemical and disinfectant, with concentration grade and delivery format dominating cost.
2) What drives the biggest price swings?
Supply-demand tightness in regional production, energy and operating costs, inventory levels, and logistics constraints.
3) How do I compare costs across grades?
Convert all quotes to $ per kg of active H₂O₂, then add logistics and compliance handling.
4) Does healthcare demand materially change pricing?
It can create short-term spikes for certain concentrations and packaging formats, but overall pricing remains heavily influenced by industrial and water treatment demand.
5) Are spot prices representative?
Spot moves can reflect near-term tightness, but for budgeting, contracts and lead times often dominate delivered pricing.
References
[1] American Chemistry Council (ACC). “Hydrogen Peroxide.” ACC Chemical Facts.
[2] U.S. International Trade Commission (USITC). Data and reports on hydrogen peroxide trade flows and tariff classification.
[3] ECHA. “Hydrogen peroxide (CAS 7722-84-1)” substance information and use categories.
[4] FAO. Food and water disinfection guidance referencing hydrogen peroxide use contexts.
[5] IHS Markit / S&P Global Chemical Market reports (hydrogen peroxide capacity and pricing coverage).
More… ↓
