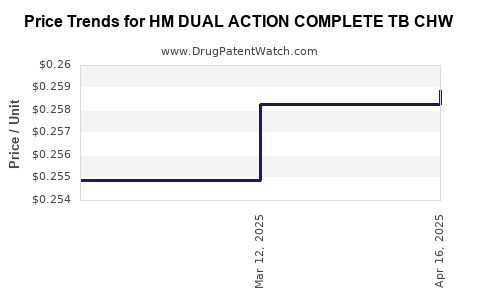
Drug Price Trends for HM DUAL ACTION COMPLETE TB CHW
✉ Email this page to a colleague
Last Updated: June 23, 2026
✉ Email this page to a colleague
Drugs may be covered by multiple patents or regulatory protections. All trademarks and applicant names are the property of their respective owners or licensors. Although great care is taken in the proper and correct provision of this service, thinkBiotech LLC does not accept any responsibility for possible consequences of errors or omissions in the provided data. The data presented herein is for information purposes only. There is no warranty that the data contained herein is error free. We do not provide individual investment advice. This service is not registered with any financial regulatory agency. The information we publish is educational only and based on our opinions plus our models. By using DrugPatentWatch you acknowledge that we do not provide personalized recommendations or advice. thinkBiotech performs no independent verification of facts as provided by public sources nor are attempts made to provide legal or investing advice. Any reliance on data provided herein is done solely at the discretion of the user. Users of this service are advised to seek professional advice and independent confirmation before considering acting on any of the provided information. thinkBiotech LLC reserves the right to amend, extend or withdraw any part or all of the offered service without notice.

Friedman, Yali. "DrugPatentWatch" DrugPatentWatch, thinkBiotech, 2026, www.DrugPatentWatch.com.
See Primary Research Papers Citing DrugPatentWatch