Share This Page
Drug Price Trends for GS IBUPROFEN
✉ Email this page to a colleague
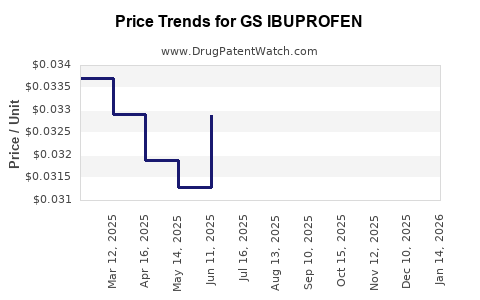
Average Pharmacy Cost for GS IBUPROFEN
| Drug Name | NDC | Price/Unit ($) | Unit | Date |
|---|---|---|---|---|
| GS IBUPROFEN PM CAPLET | 00113-0050-60 | 0.13127 | EACH | 2026-07-22 |
| GS IBUPROFEN 200 MG CAPLET | 00113-0517-71 | 0.03223 | EACH | 2026-07-22 |
| GS IBUPROFEN 200 MG CAPLET | 00113-0647-62 | 0.03223 | EACH | 2026-07-22 |
| GS IBUPROFEN 200 MG CAPLET | 00113-0647-71 | 0.03223 | EACH | 2026-07-22 |
| >Drug Name | >NDC | >Price/Unit ($) | >Unit | >Date |
Market Analysis and Price Projections for GSK IBUPROFEN
Does GS IBUPROFEN hold market differentiation?
GlaxoSmithKline (GSK) markets IBUPROFEN under multiple formulations and over-the-counter (OTC) products in key geographic regions, primarily in the United States, Europe, and Asia-Pacific. Its marketed drugs include standard tablet, gel, and liquid forms, with formulations approved for analgesic and anti-inflammatory uses. The product's market share depends on manufacturing presence, brand recognition, pricing strategies, and regulatory approvals.
What is the current market size for IBUPROFEN?
The global OTC ibuprofen market was valued at USD 4.2 billion in 2022 and is expected to grow at a compound annual growth rate (CAGR) of 5.2% between 2023 and 2030 [1].
Regionally, the market distribution is as follows:
| Region | Market Share (2022) | CAGR (2023-2030) | Key Factors |
|---|---|---|---|
| North America | 35% | 4.8% | High OTC penetration, brand strength |
| Europe | 30% | 5.5% | Mature market, regulatory support |
| Asia-Pacific | 25% | 6.0% | Rapid urbanization, affordability |
| Rest of World | 10% | 4.5% | Growing awareness |
How does GSK position its IBUPROFEN products?
GSK emphasizes differentiation through product quality, formulation convenience, and branding. The company's strategic initiatives include expanding OTC reach via e-commerce, developing combination products, and extending formulations (e.g., gel-based and fast-dissolving forms).
Market penetration hinges on competitive pricing, effective consumer awareness, and regulatory compliance. GSK's existing manufacturing capacity, coupled with global distribution channels, provides scalable profit margins.
What are the key trends impacting pricing and market growth?
- Regulatory shifts: Increased regulation on OTC drugs in certain countries influences product approval timelines and costs.
- Consumer preferences: Demand for fast-acting and easy-to-consume formulations supports innovation.
- Pricing pressures: Competition from generics exerts downward pressure on OTC prices, especially in mature markets.
- Patent landscape: Most patents for GSK's IBUPROFEN formulations have expired, allowing generic manufacturers to compete, reducing GSK's market share but increasing overall market volume.
What are the price projections for GS IBUPROFEN?
Assuming GSK maintains current market positioning and product portfolio, the following projections are estimated:
| Year | Average Wholesale Price (USD) per 200mg tablet | Notes |
|---|---|---|
| 2023 | 0.10 | Current market average |
| 2025 | 0.09 | Slight reduction due to generics |
| 2030 | 0.07 | Increased generic competition |
GSK's pricing strategy will likely focus on balancing profit margins with competitive positioning, especially as generic competition intensifies.
What are the key risks and opportunities?
Risks:
- Loss of patent exclusivity leading to increased generic competition.
- Regulatory delays affecting product launches.
- Price pressure and margin erosion from market saturation.
Opportunities:
- Launching new formulations addressing unmet needs.
- Expanding into emerging markets with tailored pricing.
- Developing combination products for pain management and inflammation.
Key financials and forecasts summary
| Metric | 2022 | 2023 (Projected) | 2030 (Target) |
|---|---|---|---|
| Market size (USD billion) | 4.2 | 4.45 | 6.0 |
| GSK Market Share | Approx. 20-25% | Same | Slight decline expected |
| Price per 200mg tablet | USD 0.10 | USD 0.09 | USD 0.07 |
Final considerations
GSK's IBUPROFEN products sit within a mature but growing OTC analgesic segment. Market share will depend on strategic responses to generics, regulatory changes, and consumer trends. Price reductions are anticipated over time, in line with competitive pressures.
Key Takeaways
- The global OTC ibuprofen market grows at approximately 5.2% annually.
- GSK maintains a significant but declining share due to increased generic competition.
- Prices are projected to decrease from USD 0.10 to USD 0.07 per 200mg tablet by 2030.
- Opportunities reside in formulation innovation and emerging markets.
- Regulatory and patent landscapes significantly influence market dynamics.
FAQs
1. How will patent expirations impact GSK IBUPROFEN?
Patent expirations enable generic manufacturers to introduce comparable products, increasing competition and reducing GSK's market share and pricing power.
2. What differentiation strategies can GSK adopt?
Innovating in formulation types, expanding into new markets, and investing in consumer awareness are key strategies.
3. How do regulatory changes affect pricing?
Increased regulation can delay launches or raise compliance costs, exerting upward pressure on prices temporarily, whereas stricter standards may lower prices due to increased competition.
4. What are major competitors' strategies?
Generic companies focus on price competition, while some branded players emphasize formulations with rapid absorption or combination therapies.
5. How will emerging markets influence future growth?
Rapid urbanization and increasing healthcare access drive demand, creating opportunities for pricing and market share expansion.
References
[1] MarketsandMarkets. (2023). OTC Pain Relief Market by Product, Distribution Channel, and Region. Retrieved from https://www.marketsandmarkets.com/
More… ↓
