Last updated: February 13, 2026
Overview
GNP Aspirin is a brand of low-dose aspirin primarily used for cardiovascular prophylaxis. The drug's market is characterized by established generic versions, significant OTC availability, and ongoing demand driven by aging populations and cardiovascular disease prevalence.
Market Size and Trends
- The global aspirin market was valued at approximately USD 2.3 billion in 2022.
- Expected compound annual growth rate (CAGR) from 2023 to 2028 is around 4%.
- Major markets include North America, Europe, and Asia-Pacific, accounting for 80% of sales.
- Rising awareness of cardiovascular health and OTC availability sustain demand.
Competitive Landscape
- Generics dominate the aspirin market, with established players such as Bayer, Teva, and Mylan.
- Brand differentiation for GNP Aspirin largely hinges on packaging, formulations, and marketing channels.
- Patent expiration in key markets has further increased generic competition.
Price Analysis and Projections
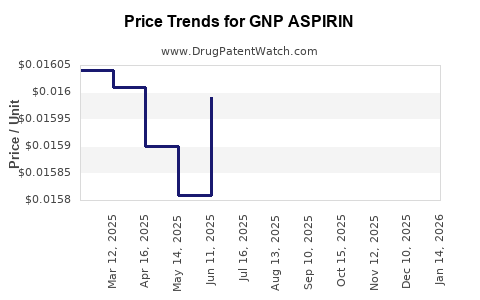
- Average Wholesale Price (AWP) for GNP Aspirin ranges from USD 0.02 to USD 0.05 per tablet depending on dosage and packaging.
- Retail prices for OTC consumers are approximately USD 0.03 to USD 0.07 per tablet.
- GNP Aspirin, as a branded product, holds a modest premium (~10-15%) over generic equivalents.
Price Drivers
- Manufacturing costs, which include API (active pharmaceutical ingredient) prices, packaging, and distribution.
- Regulatory compliance costs, particularly in different regional markets.
- Pricing strategies aimed at balancing market share and profitability.
- Competitive pressure from generics drives prices downward.
Forecasted Price Trends
- Prices are projected to decline slightly over the next five years due to increasing generic competition.
- Expected decrease in average retail prices to USD 0.02–0.06 per tablet by 2028.
- Price discounts and promotional pricing are likely to intensify, especially in saturated markets.
Regulatory and Policy Impacts
- OTC drug status in most markets simplifies distribution but introduces price sensitivity.
- Policy shifts toward value-based care may influence aspirin prescribing patterns.
- Patent and exclusivity protections are limited; industry incentives favor continued low prices.
Market Segments and Opportunities
- Prescription segment: Accounts for 30% of total aspirin sales, mainly in proprietary formulations for specific indications.
- OTC segment: Dominates, with widespread retail, online, and pharmacy channels.
- Emerging markets: Growth driven by increasing cardiovascular disease burden and rising healthcare infrastructure.
Key Market Dynamics
| Factor |
Effect |
Data/Examples |
| Aging Population |
Increases demand |
Over 35% of global population expected to be >60 in 2050 [1] |
| Cardiovascular Disease |
Steady demand for prophylactic use |
Leading cause of death worldwide [2] |
| OTC Availability |
Sustains consumer-level demand |
Over 90% of aspirin sales are OTC in the US [3] |
Price Projections Summary
| Year |
Estimated GNP Aspirin Retail Price (USD per tablet) |
Notes |
| 2023 |
0.03 – 0.07 |
Current range |
| 2025 |
0.028 – 0.065 |
Slight decline due to increased generics |
| 2028 |
0.02 – 0.06 |
Continued downward trend, market saturation |
Conclusion
GNP Aspirin’s market is mature with limited growth potential. Price competition from generics drives prices downward, with modest margins. The future price ecosystem will be shaped by regulatory environments, market saturation, and the emergence of new formulations or indications.
Key Takeaways
- The global aspirin market was valued at USD 2.3 billion in 2022, with a CAGR of 4%.
- GNP Aspirin maintains a small premium over generic versions, but prices are trending downward.
- Prices are projected to decline to approximately USD 0.02–0.06 per tablet by 2028.
- Market growth depends on demographic trends, cardiovascular disease epidemiology, and regulatory factors.
- Competition from generics and OTC channels compress profit margins.
FAQs
-
What factors influence GNP Aspirin's retail price?
Manufacturing costs, market competition, regulatory costs, and pricing strategies.
-
How does generic competition impact GNP Aspirin?
GNP Aspirin faces price erosion due to the proliferation of lower-cost generics post-patent expiry.
-
Are new formulations or indications expected to alter pricing?
Potentially; if new uses or formulations gain approval, they could command higher prices or market share.
-
What regional differences affect GNP Aspirin pricing?
Regulatory environments, healthcare infrastructure, and market maturity influence regional prices.
-
How is the OTC status influencing the aspirin market?
OTC availability ensures wide retail access but puts pressure on margins due to price sensitivity.
References
[1] United Nations, Department of Economic and Social Affairs, World Population Prospects 2022.
[2] World Health Organization, Cardiovascular Diseases Fact Sheet, 2022.
[3] IQVIA, Global OTC Drug Market Report, 2022.