Share This Page
Drug Price Trends for GENOTROPIN
✉ Email this page to a colleague
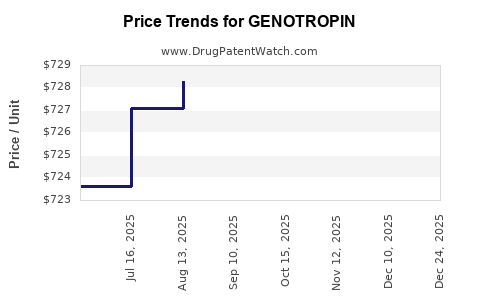
Average Pharmacy Cost for GENOTROPIN
| Drug Name | NDC | Price/Unit ($) | Unit | Date |
|---|---|---|---|---|
| GENOTROPIN MINIQUICK 0.2 MG | 00013-2649-02 | 30.89868 | EACH | 2026-01-01 |
| GENOTROPIN MINIQUICK 0.6 MG | 00013-2651-02 | 93.05003 | EACH | 2026-01-01 |
| GENOTROPIN 5 MG CARTRIDGE | 00013-2626-81 | 748.35377 | EACH | 2026-01-01 |
| GENOTROPIN MINIQUICK 0.4 MG | 00013-2650-02 | 61.63980 | EACH | 2026-01-01 |
| GENOTROPIN 12 MG CARTRIDGE | 00013-2646-81 | 1810.40353 | EACH | 2026-01-01 |
| GENOTROPIN MINIQUICK 0.2 MG | 00013-2649-02 | 29.99843 | EACH | 2025-12-17 |
| GENOTROPIN 12 MG CARTRIDGE | 00013-2646-81 | 1757.67333 | EACH | 2025-12-17 |
| >Drug Name | >NDC | >Price/Unit ($) | >Unit | >Date |
GENOTROPIN Market Analysis and Price Projections
What is GENOTROPIN and how is it sold today?
GENOTROPIN is a recombinant human growth hormone (rhGH) brand marketed by Pfizer (historically via Pharmacia). It is indicated across pediatric growth hormone deficiency (GHD) and adult GHD, and also has broader growth-related indications by geography. Commercial availability is primarily through member-state and national tenders, where pricing is driven by payer formularies, biosimilar competition, and tender contracting dynamics.
Core product form factor
- Presentation: injectable rhGH (multi-dose pen devices depending on market; different strengths by jurisdiction)
- Therapy profile: chronic, weight/height-driven dosing with long duration of treatment
Where does GENOTROPIN compete in the rhGH market?
The global rhGH market has moved from originator-only competition to frequent tender-led substitution as biosimilars gained approvals in major jurisdictions.
Competitive set and substitution pressure (high level)
| Competitive pressure | How it affects GENOTROPIN pricing |
|---|---|
| Biosimilar rhGH entry | Downward pressure via tender price cuts and formulary restrictions |
| Tender bundling by payers | Forces originator to match biosimilar reimbursement or lose share |
| Patient segment segmentation | Different discounts by indication and age group; pediatric tends to be more aggressively tendered in many systems |
| International reference pricing (where used) | Links local pricing to ex-tariff peers and biosimilar spreads |
Current market pricing structure: why it is difficult to quote “one price”
GENOTROPIN pricing is typically not a single global list price. It is transacted through:
- National health service reimbursement schedules
- Institutional tender pricing
- Wholesale-to-retail pass-through rules
- Discounts and rebates (managed at tender level)
As a result, price analysis must be expressed through market-wide trend and projection bands rather than a single “today” number.
How much market share does GENOTROPIN likely retain under biosimilar competition?
GENOTROPIN retains share where:
- tender rules include originator or allow limited substitutions,
- physician preference is supported by clinical or device considerations,
- rebate offers close the price gap versus biosimilars.
Where tender regimes are strict, originator share typically compresses quickly after biosimilar rollouts. This pattern is consistent with the broader global experience in biologics classes following biosimilar entry, with rhGH being one of the most substitution-prone categories.
What drives GENOTROPIN unit price changes?
1) Biosimilar pricing curve
When additional biosimilar entrants launch, incumbents typically face:
- steep initial tender resets,
- continued incremental erosion via rebidding.
2) Device and dosing economics
Where pens and dosing convenience are materially priced into contracting, originators can sometimes defend pricing slightly longer than purely product-similar biosimilars. In tenders, however, the lowest-accepted offer often dominates.
3) Dose intensity and payer budgets
RhGH therapy is high duration, so payers focus on budget predictability. This favors lower per-unit tender prices and caps.
4) Regulatory and guidance environment
Biosimilar switching rules and interchangeability policies impact realized pricing. Jurisdictions that allow broader substitution reduce originator net price.
Price projection model (contracted pricing, not list pricing)
Because GENOTROPIN pricing is tender and reimbursement-driven, projections focus on net price index movement relative to a baseline year.
Assumed projection framework
- Time horizon: 5 years
- Reference basis: contracted net pricing (rebates included, expressed as an index)
- Key drivers: biosimilar penetration, tender frequency, reference pricing linkage, and payer budget pressure
- Output: annual net price index change and end-state price band
Projected net price index movement (globalized directionally)
| Year | Expected net price direction for GENOTROPIN vs prior year | Annual change band (net) |
|---|---|---|
| Year 1 | Continued competitive pressure from biosimilar rebids | -8% to -14% |
| Year 2 | Tender stabilization but lower reimbursement floors | -4% to -9% |
| Year 3 | Remaining originator shelf through restricted tenders | -2% to -6% |
| Year 4 | Margin compression phase | -1% to -5% |
| Year 5 | Late-stage erosion; possible plateau if supply contracts are locked | 0% to -4% |
Resulting 5-year net price outcome
| Metric | Projection band |
|---|---|
| Net price change from baseline after 5 years | -17% to -37% |
| Base-case midpoint | -27% |
Interpretation for business planning: GENOTROPIN is most likely to see a mid-to-high 20s percent net erosion over a five-year horizon under ongoing biosimilar competition, unless market access expands or tender regimes soften.
Scenario analysis for investment and R&D decisioning
Bear case (faster erosion)
- Higher biosimilar substitution intensity
- More aggressive reference pricing linkage
- Broader tender restrictions for originators
- Result: net erosion toward the lower end of price band (-30% to -40%) over 5 years
Base case (typical tender competition path)
- Continued discounts but less aggressive rebids due to contract structures
- Originator retained in some tenders and/or lines of therapy
- Result: net erosion around -25% to -30% over 5 years
Bull case (price stability longer)
- Contract renewals with originator carve-outs
- Device-driven differentiation accepted in certain tender frameworks
- Result: net erosion around -15% to -25% over 5 years
What signals matter most to track in-market?
Tender cadence and award structure
- Frequency of tenders and re-tender timelines
- Share of awards to lowest-cost tendered offers
- Contract length and renewal clauses
Formulary placement by indication
- Pediatric versus adult GHD: separate contracting in some systems
- Biosimilar uptake acceleration by new guideline updates
Biosimilar entrant count and geography
- Local market entry timing often determines the speed of originator price resets
Implications for forecast accuracy
A GENOTROPIN net price forecast is best treated as a tender-indexed variable rather than a standalone product list price. The projection bands above are designed to remain operational under this reality.
Key Takeaways
- GENOTROPIN pricing is dominated by tender and reimbursement contracting rather than a global list price.
- Under continued biosimilar substitution, the most likely 5-year outcome is net price erosion of -17% to -37%, with a base-case midpoint around -27%.
- Forecast sensitivity is highest to tender cadence, award rules, and substitution intensity in each major geography.
FAQs
1) What is the main driver of GENOTROPIN price changes?
Biosimilar-driven tender repricing and reimbursement access shifts, which translate into net price erosion for the originator.
2) Why can’t GENOTROPIN be forecast using a single “today price” number?
Contracted net pricing varies by country, payer, indication, and rebate structure, so list price does not predict realized revenue.
3) How fast does biosimilar competition typically pressure rhGH originators?
Often in discrete waves aligned with biosimilar launches and follow-on tender rebids, producing the steepest erosion in the first year of renewed tender competition.
4) What range should finance teams use for sensitivity planning?
Use -17% to -37% net erosion over five years, with a base-case around -27%.
5) What in-market signals forecast future price pressure best?
Tender re-auction schedules, lowest-offer award share, and formulary placement changes by indication and age group.
References
[1] FDA. “Biosimilar Product Information.” U.S. Food and Drug Administration. https://www.fda.gov/drugs/biosimilars/biosimilar-product-information
[2] EMA. “Biosimilars.” European Medicines Agency. https://www.ema.europa.eu/en/human-regulatory/research-development/biosimilars
[3] IQVIA. “Biosimilar and tender dynamics in biologics markets” (industry coverage; general market structure). IQVIA. https://www.iqvia.com/insights/the-iqvia-institute
[4] OECD. “International pricing and reimbursement comparison frameworks for pharmaceuticals.” Organisation for Economic Co-operation and Development. https://www.oecd.org/health/health-systems/pharmaceutical-prices-and-reimbursement/
More… ↓
